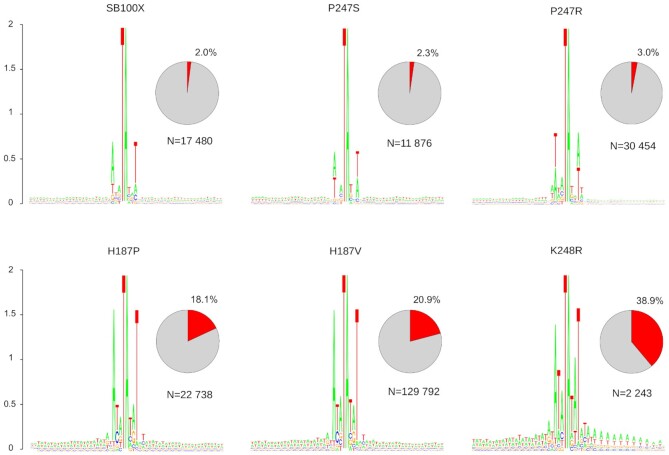
Figure 4.
Integration sites of the transposase mutants. The sequence logos show the majority-rule consensus sequences at the genomic insertion loci in a 60-bp window, centered around the target TA dinucleotides. The value 2 (log2 4) on the y axis stands for maximum possible frequency. The pie charts depict the percentages of insertions occurring at the SB-specific ATATATAT consensus motif. The N values represent the numbers of uniquely mappable SB transposon insertions.

