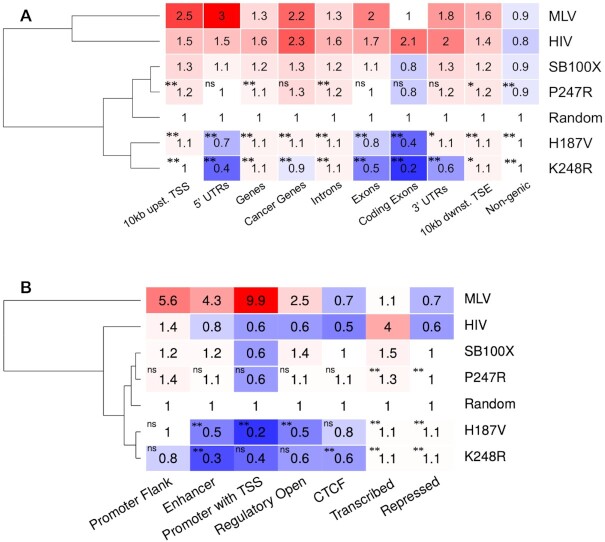
Figure 5.
Representation of insertion sites in genic features and chromatin-defined functional segments. (A) Integration loci of MLV, HIV, SB100X and its mutant derivatives were counted in gene-related segments of the human genome. The numbers represent fold change increase (red) or decrease (blue) in insertion frequencies compared to a theoretical random control (set to 1). The dendogram on the left is based on the mean frequency values of the rows. Statistical significance (Fisher's exact test) measured for the values of the K248R, P247R and H187V mutants versus SB100X is indicated by stars; * P< 0.05, ** P< 0.001, ns: not significant. (B) Representation of insertion sites in functional genomic segments as defined by epigenetic signal patterns. Color code, dendogram and statistical significance as indicated for panel (A).

