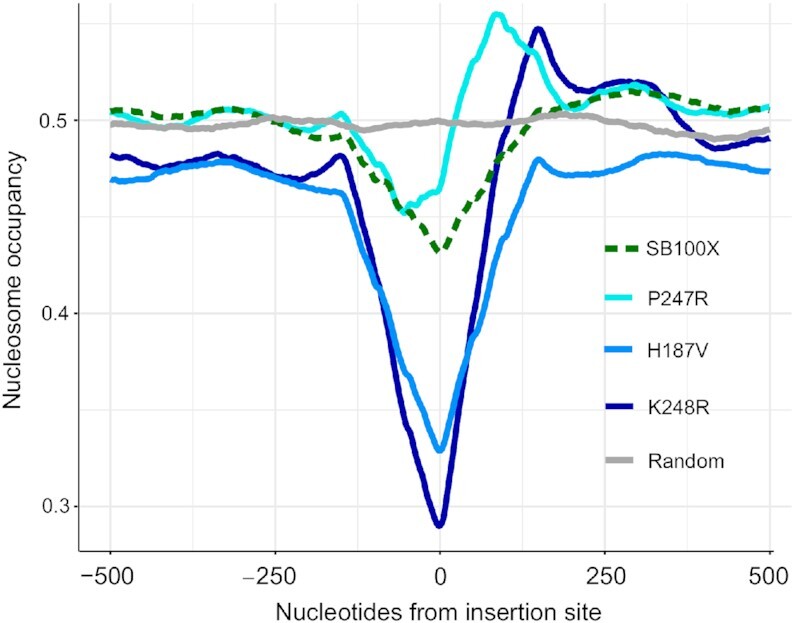
Figure 7.

Nucleosome occupancy at transposon insertion sites. Mean calculated probabilities of the nucleotides for being present on a nucleosome are shown on the y-axis. The occupancy prediction was implemented on all the insertion sequences of the corresponding transposase versions. The probabilities are depicted in a window that extends 500 bp upstream and 500 bp downstream from the transposon integration sites. 0 stands for the insertion site.
