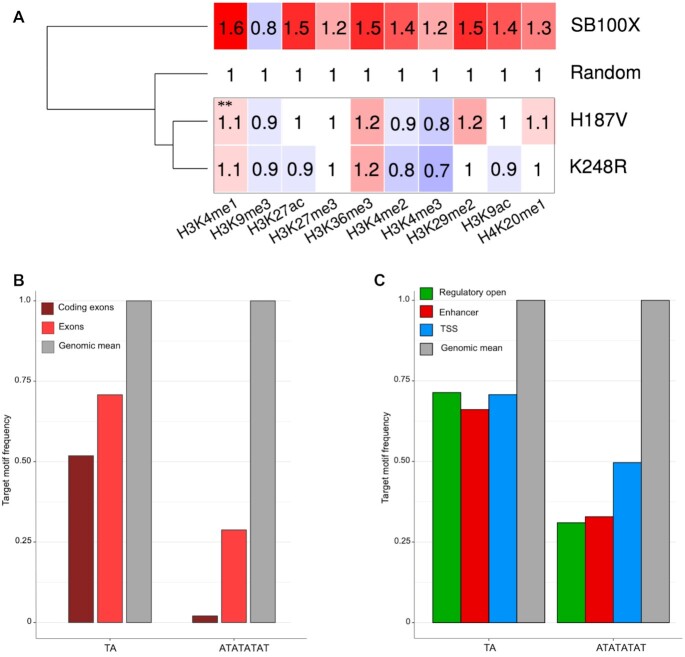
Figure 8.
Molecular features associated with preferential genomic target sites of the H187V and K248R transposase mutants. (A) Relative co-occurrence of transposon integration sites with histone tail modifications. The numbers represent fold change increase (red) or decrease (blue) in insertion frequencies within ChiP-Seq peaks compared to a theoretical random control (set to 1). The dendogram on the left is based on the mean frequency values of the rows. ** P< 0.001, Fischer's exact test as compared to SB100X. (B) Relative frequencies of TA dinucleotides and ATATATAT octanucleotides in exonic sequences. Genomic mean is included as reference and is set to 1. (C) Relative frequencies of TA dinucleotides and ATATATAT octanucleotides in transcriptional regulatory sequences including enhancers, open regulatory regions and TSSs. Genomic mean is included as reference and set to 1.

