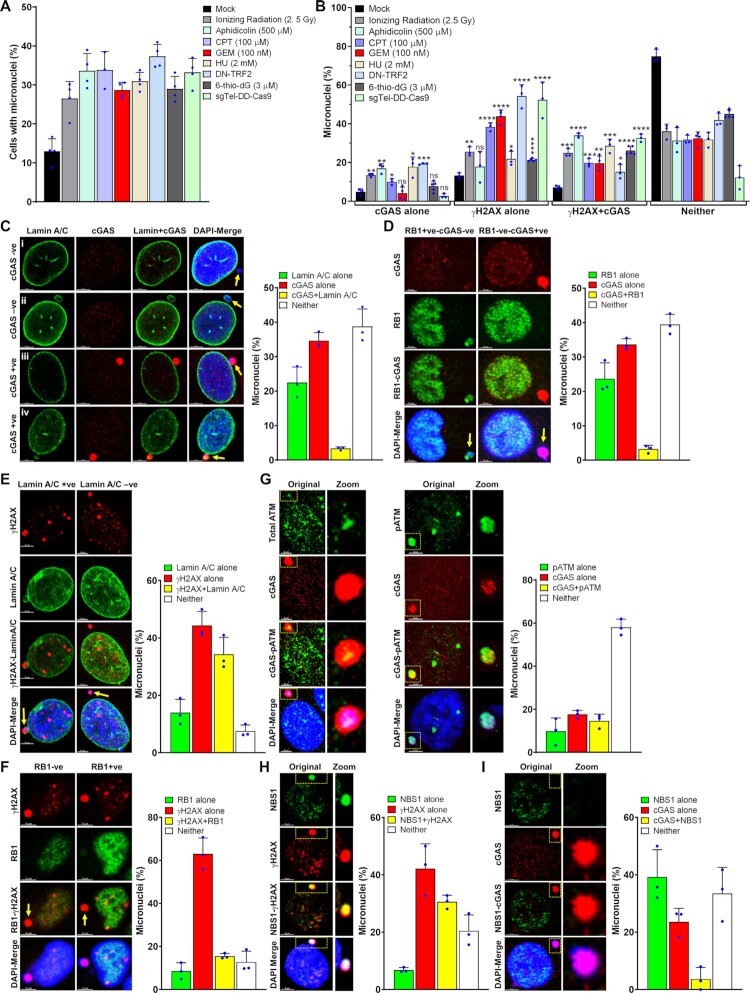
Figure 1.
cGAS is recruited to only a sub-population of nuclear envelope–ruptured micronuclei in response to genotoxic stress. (A, B) cGAS is recruited to only a limited number of micronuclei. Bar graphs show percentages of micronuclei-positive cells (A) and the percentage of micronuclei harboring either cGAS alone, γH2AX alone, cGAS and γH2AX or neither (B) at 24–72 h after exposing human bronchial epithelial (BEAS2B) cells to either mock or different DNA damaging agents (APH/CPT/GEM/6-thio-dG); HT1080 + DN-TRF2 cells treated with doxycycline (DN-TRF2); and HT1080 + sgTel-DD-Cas9 cells concomitantly treated with doxycycline and Shield1 (sgTel-DD-Cas9). The bar graph presents the mean and STDEV from three to five independent experiments. Statistical analysis was performed by using Student's t-test. APH–aphidicolin; CPT–camptothecin; GEM–gemcitabine; HU–hydroxyurea; 6-thio-dG–6-thio-2′-deoxyguanine; DN-TRF2–overexpression of doxycycline-inducible dominant negative telomeric-repeat binding factor 2; sgTel-DD-Cas9–CRISPR/Cas9-mediated induction of DNA double-strand breaks in the telomeric-repeat DNA. * P ≤ 0.05; ** P ≤ 0.01; *** P ≤ 0.001; **** P ≤ 0.0001. (C, D) Not all micronuclei (MN) with ruptured nuclear envelopes (NE) recruit cGAS. Representative images show cGAS-negative and Lamin A/C–negative (i), cGAS-negative and Lamin A/C–positive (ii), cGAS-positive and Lamin A/C (NE)–negative (iii) and cGAS-positive and Lamin A/C (weak)–positive (iv) micronuclei (C, left panels). Bar graph shows the frequency of micronuclei harboring either Lamin A/C alone, cGAS alone, cGAS and Lamin A/C or neither in BEAS2B cells treated with 3 μM 6-thio-dG for 72 h (C, right). Representative images show localization of either cGAS or RB1 in micronuclei (D, left). Bar graph shows the frequency of micronuclei harboring either RB1 alone, cGAS alone, cGAS and RB1 or neither in BEAS2B cells treated with 3 μM 6-thio-dG (D, right). Bar graph presents the mean and STDEV from 150–200 cells from three independent experimental groups. (E) A major fraction of γH2AX-positive micronuclei are devoid of a nuclear envelope. Representative images show the presence or absence of γH2AX in Lamin A/C coating–positive and negative micronuclei (left). Bar graph shows the frequency of micronuclei harboring either Lamin A/C alone, γH2AX alone, Lamin A/C and γH2AX, or neither in BEAS2B cells treated with 3 μM 6-thio-dG for 72 h (right). Bar graph presents the mean and STDEV from three independent experimental groups. +ve–positive; -ve–negative. (F) Representative images show the presence or absence of γH2AX in RB1-positive and RB1-negative micronuclei (left). Bar graph shows the percentage of micronuclei harboring either γH2AX alone, RB1 alone, γH2AX and RB1 or neither in BEAS2B cells treated with 3 μM 6-thio-dG for 72 h (right). Bar graph presents the mean and STDEV from three independent experimental groups. (G) Recruitment and phosphorylation of ATM (pATM, S1981) in micronuclei, and a fraction of pATM co-localizes with cGAS. Representative images show co-localization of total ATM (left) and phosphorylated ATM (S1981; middle) with cGAS in micronuclei. Bar graphs show the frequency of micronuclei containing either pATM alone, cGAS alone, pATM and cGAS or neither in BEAS2B cells treated with 3 μM 6-thio-dG. Bar graph presents the mean and STDEV from three independent experimental groups. (H, I) NBS1 is recruited to γH2AX-positive micronuclei but rarely co-localizes with cGAS. Representative images show the presence of NBS1 and γH2AX (H, left) and only cGAS but no NBS1 (I, left) in micronuclei. Bar graphs show the frequency of micronuclei harboring either NBS1 alone, γH2AX alone, NBS1 and γH2AX or neither (H, right) and NBS1 alone, cGAS alone, NBS1 and cGAS or neither (I, right) in BEAS2B cells treated with 3 μM 6-thio-dG for 72 h. Bar graph presents the mean and STDEV from three independent experimental groups.

