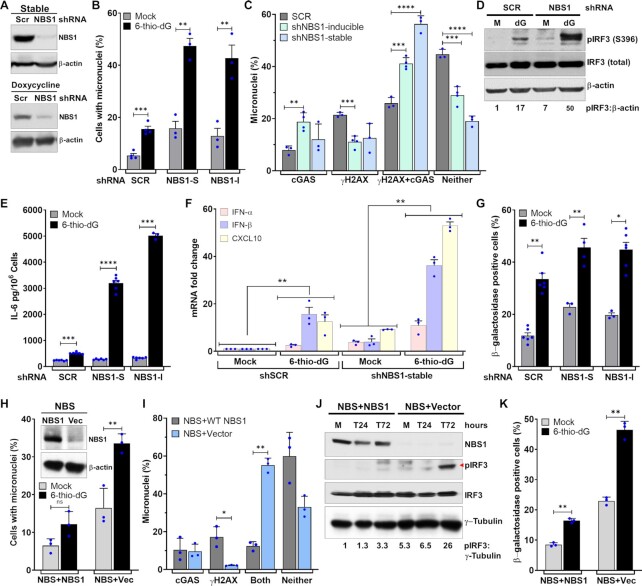
Figure 2.
NBS1 deficiency enhances cGAS-positive micronuclei. (A–C) Stable and transient NBS1 knockdown enhances cGAS-positive micronuclei. Representative western blots show stable (top) and doxycycline (lower)-mediated NBS1 depletion in BEAS2B cells (A). Bar graph shows percentages of micronuclei in mock- and 3 μM 6-thio-dG (72 h)–treated BEAS2B cells stably expressing scrambled (SCR), stable (NBS1-S), and doxycycline-inducible (NBS1-I) shNBS1 RNAs (B). Bar graph shows the percentage of micronuclei harboring either cGAS alone, γH2AX alone, cGAS and γH2AX or neither in BEAS2B cells expressing scrambled (SCR), stable, and doxycycline-inducible shNBS1 RNAs at 72 h after 3 μM 6-thio-dG treatment (C). Bar graph presents the mean and STDEV from three independent experiments. Statistical analysis was performed using Student's t-test. (D–G) NBS1 knockdown enhances IRF3 phosphorylation, IL-6 secretion, expression of immune genes and cellular senescence. Representative western blot shows phosphorylation of IRF3 (S396; D), and the bar graph shows the level of IL-6 in the BEAS2B cell culture supernatant (E) in mock-treated cells and at 72 h after 3 μM 6-thio-dG (dG) treatment. Graph shows greater expression of immune pathway genes in shNBS1 RNA cells treated with 3 μM 6-thio-dG than in shSCR RNA cells (F). Bar graph shows the frequency of β-galactosidase staining–positive cells at 10 days after 3 μM 6-thio-dG treatment in shSCR, shNBS1-stable (S) and doxycycline-inducible (I) RNA-expressing BEAS2B cells (G). Bar graph presents the mean and STDEV from three-six independent experiments. Statistical analysis was performed using Student's t-test (E and G) and two-way ANOVA (F). (H, I) Elevated levels of cGAS-positive micronuclei in patient-derived NBS1-mutant (NBS) cells. Representative western blots show expression of NBS1 in NBS cells complemented with NBS1 and vector alone (vec) (H, inset). Bar graph shows the percentage of micronuclei in mock- and 5 μM 6-thio-dG (72 h)–treated NBS1-mutant (NBS + Vec) and NBS cells complemented with WT NBS1 (NBS + NBS1; H). Bar graph shows the percentage of micronuclei harboring either cGAS alone, γH2AX alone, cGAS and γH2AX or neither in NBS1-mutant (NBS + Vector) and NBS cells complemented with WT NBS1 (NBS + NBS1) at 72 h after 5 μM 6-thio-dG treatment. Bar graphs present the mean and STDEV from three independent experiments. Statistical analysis was performed using Student's t-test. (J, K) NBS1 deficiency enhances IRF3 phosphorylation and exacerbates premature senescence. Representative western blots show increased activation of IRF3 (S396) in NBS cells relative to NBS cells complemented with NBS1 at indicated times after 6-thio-dG treatment (J). NBS cells show higher levels of β-galactosidase staining than NBS + NBS1 cells 7 days after 5 μM 6-thio-dG treatment (K). Bar graph presents the mean and STDEV from 12–15 different fields from three independent experiments. Statistical analysis was performed using Student's t-test. * P ≤ 0.05; ** P ≤ 0.01; *** P ≤ 0.001; **** P ≤ 0.0001.

