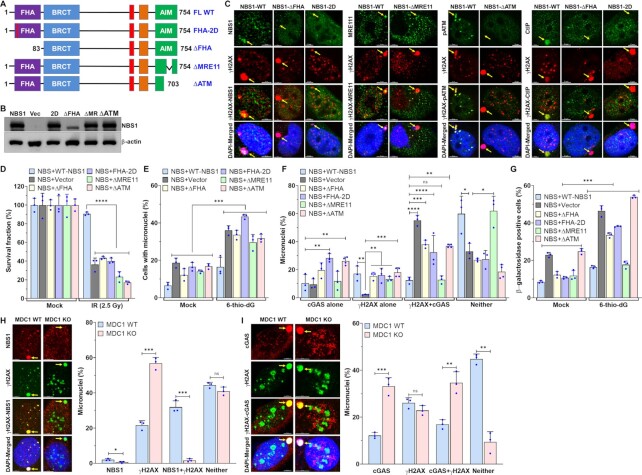
Figure 3.
ATM- and CtIP-binding domains of NBS1 are critical for regulating cGAS binding to micronuclear DNA. (A, B) Schematics of different NBS1 mutant constructs used in this study (A). Representative western blot shows stable expression of different NBS1 mutants in patient-derived NBS cells (B). FHA–fork head-associated domain; BRCT–BRCA1/2 C-terminus domain; AIM–ATM-MRE11 interaction domain; FL-WT–full length wild-type; Vec–vector alone; ΔFHA–delta FHA; ΔMR–delta MRE11 and 2D-FHA–2D. (C) ΔFHA- and FHA-2D-mutant NBS1 not only failed to bind to micronuclei but also failed to recruit CtIP to micronuclei; ΔMRE11-NBS1 does not cause the translocation of MRE11 from the cytoplasm to the nuclear compartment, and ΔATM-NBS1 does not phosphorylate ATM in micronuclei. Representative confocal images show recruitment of NBS1 and its binding partners to micronuclei in NBS cells stably expressing WT- and ΔFHA-, FHA-2D-, ΔMRE11- and ΔATM- mutant-NBS1. Exponentially growing cells were exposed to 2.5 Gy ionizing radiation (IR) and subjected to immunostaining with indicated antibodies at 24 h after IR. (D) NBS cells stably expressing ΔFHA-, FHA-2D-, ΔMRE11- and ΔATM-mutant NBS1, but not WT-NBS1, are sensitive to ionizing radiation. Exponentially growing cells were exposed to 2.5 Gy ionizing radiation and allowed to form colonies for 10 days. Colonies were stained with Crystal violet solution, and the surviving fraction was calculated in three independent experiments. (E–G) Defects in the FHA and ATM-binding domains of NBS1 cause increased numbers of cGAS-positive micronuclei and senescent cells. Bar graph shows percentages of micronuclei in NBS cells stably expressing FHA-2D-, ΔFHA-, ΔMRE11- and ΔATM-NBS1 mutants at 72 h after mock- and 5 μM 6-thio-dG treatment (E). Bar graph shows the percentage of micronuclei harboring either cGAS alone, γH2AX alone, cGAS and γH2AX or neither in NBS cells stably expressing FHA-2D-, ΔFHA-, ΔMRE11- and ΔATM-NBS1 mutants at 72 h after 5 μM 6-thio-dG treatment (F). NBS cells stably expressing FHA-2D-, ΔFHA- and ΔATM-NBS1 mutants show higher levels of β-galactosidase staining than NBS + WT-NBS1 cells 7 days after 5 μM 6-thio-dG treatment (G). Bar graph presents the mean and STDEV from three independent experiments. Statistical analysis was performed using two-way ANOVA (E and F) and Student's t-test (G). (H, I) NBS1 is rarely recruited to micronuclei in the absence of MDC1: Representative images show the presence of NBS1 and γH2AX in the same micronucleus of MDC1 wild type (WT) but not in MDC1 knockout (KO) cells (H, left). Bar graph shows the frequency of micronuclei harboring either NBS1 alone, γH2AX alone, NBS1 and γH2AX or neither (H, right). Representative images show the presence of cGAS and γH2AX in the same micronucleus of MDC1 WT and in MDC1 KO cells (I, left) and the bar graph shows the frequency of micronuclei harboring either γH2AX alone, cGAS alone, γH2AX and cGAS or neither (I) in MDC1 WT and KO mouse embryonic fibroblasts 24 h after 2.5 Gy ionizing radiation. Bar graph presents the mean and STDEV from three independent experimental groups. * P ≤ 0.05; ** P ≤ 0.01; *** P ≤ 0.001; **** P ≤ 0.0001.

