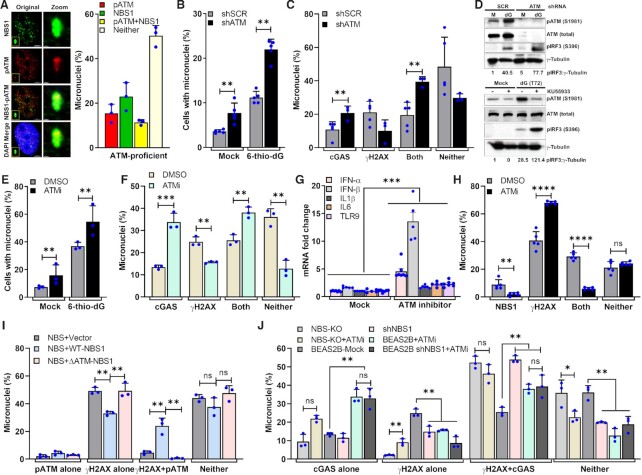
Figure 4.
NBS1-mediated ATM recruitment to micronuclear DNA attenuates cGAS binding. (A) NBS1 co-localizes with phosphorylated ATM in micronuclei. Representative images show co-localization of NBS1 and phosphorylated ATM (S1981; left). Bar graph shows the frequency of micronuclei harboring either NBS1 alone, pATM alone, NBS1 and pATM or neither in BEAS2B cells treated with 6-thio-dG (72 h). Bar graph presents the mean and STDEV from three independent experiments. (B–D) ATM knockdown increases cGAS-positive micronuclei. Bar graph shows the frequency of micronuclei formation in mock- and 3 μM 6-thio-dG–treated shSCR and shATM cells (B). Bar graph shows the frequency of micronuclei harboring either cGAS alone, γH2AX alone, cGAS and γH2AX or neither in SCR shRNA- and ATM shRNA-expressing cells 72 h after 3 μM 6-thio-dG treatment (C). Bar graph presents the mean and STDEV from three independent experimental groups. Statistical analysis was performed using Student's t-test. ** P ≤ 0.01; *** P ≤ 0.001; **** P ≤ 0.0001. Representative western blot shows higher levels of IRF3 phosphorylation in shRNA-mediated ATM knockdown HeLa cells than in SCR shRNA-expressing HeLa cells (D, top) and in ATM inhibitor (KU55933)-treated cells than in DMSO-treated BEAS2B cells (D, bottom) exposed to 3 μM 6-thio-dG (dG) for 72 h. (E–G) Inhibition of ATM kinase activity enhances cGAS recruitment to micronuclear DNA. Bar graphs show the frequency of micronuclei formation (E), elevated levels of cGAS-positive micronuclei (F) and expression of IFN-α, IFN-β, IL1-α, IL6 and TLR9 (G) in cells treated with ATM kinase inhibitor (KU55933) as compared with DMSO-treated cells. Bar graph presents the mean and STDEV from three independent experiments. Statistical analysis was performed using Student's t-test. (H) Inhibiting ATM kinase activity reduces NBS1 recruitment to micronuclei. Bar graph shows the percentage of micronuclei containing either γH2AX alone, NBS1 alone, γH2AX and NBS1 or neither in DMSO- and ATM inhibitor (KU55933)-treated BEAS2B cells exposed to 3 μM 6-thio-dG for 72 h. Bar graph presents the mean and STDEV from three independent experiments. Statistical analysis was performed using Student's t-test. (I) Number of phosphorylated ATM–positive micronuclei is attenuated in NBS + Vector and NBS+ΔATM NBS1 cells. Bar graph shows the frequency of micronuclei harboring either pATM alone, γH2AX alone, pATM and γH2AX or neither in NBS + Vector, NBS + WT-NBS1 and NBS+ΔATM-NBS1 cells at 24 h after exposure to 2.5 Gy IR. Bar graph presents the mean and STDEV from three independent experiments. Statistical analysis was performed using Student's t-test. (J) Loss of both NBS1 and ATM functions is epistatic with respect to cGAS accumulation at micronuclei. Bar graph shows the percentage of micronuclei containing either cGAS alone, γH2AX alone, cGAS+γH2AX or neither in DMSO- and ATM inhibitor (KU55933)-treated BEAS2B + shNBS1 and NBS cells at 24 h after exposure to 2.5 Gy IR. Bar graph presents the mean and STDEV from three independent experiments. Statistical analysis was performed using Student's t-test. * P ≤ 0.05; ** P ≤ 0.01; *** P ≤ 0.001; **** P ≤ 0.0001.

