Figure 5.
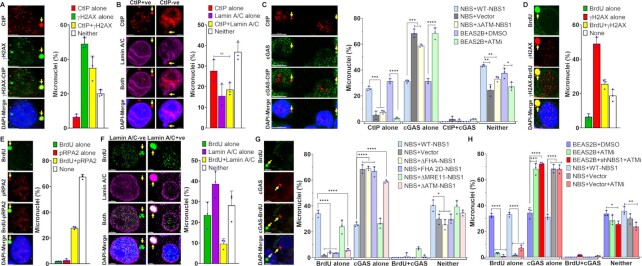
CtIP-positive and end-resected micronuclear DNA are defective in cGAS binding. (A–C) CtIP is recruited to micronuclei but does not co-localize with cGAS. Representative images show co-localization of CtIP with γH2AX (A, left), Lamin A/C (B, left) and cGAS (C, left) in the micronuclei. Bar graphs show the frequency of micronuclei harboring either CtIP alone, γH2AX alone, CtIP and γH2AX or neither (A, graph) and CtIP alone, Lamin A/C alone, CtIP and Lamin A/C or neither (B, graph) in BEAS2B cells at 24 h after exposure to 2.5 Gy IR. Bar graph shows the frequency of micronuclei harboring either CtIP alone, cGAS alone, CtIP and cGAS or neither in NBS + Vector, NBS + WT NBS1, NBS+ΔATM NBS1, BEAS2B + DMSO and BEAS2B + ATM inhibitor (10 μM KU55933) cells at 24 h after exposure to 2.5 Gy IR (C, graph). Bar graphs present the mean and STDEV from three independent experiments. (D–G) Most micronuclear DNA with end-resected ssDNA are negative for cGAS. Representative images show co-localization of end-resected ssDNA marker (BrdU) with γH2AX (D, left), pRPA2 (E, left), Lamin A/C (F, left) and cGAS (G, left) in the micronuclear DNA. Bar graphs show the frequency of micronuclear DNA harboring either BrdU alone, γH2AX alone, BrdU and γH2AX or neither (D, graph); BrdU alone, pRPA2 alone, BrdU and pRPA2 or neither (E, graph); BrdU alone, Lamin A/C alone, BrdU and Lamin A/C or neither (F, graph) in BEAS2B cells at 24 h after exposure to 2.5 Gy IR. Bar graph shows the frequency of micronuclei harboring either BrdU alone, cGAS alone, BrdU and cGAS or neither in NBS and NBS cells stably expressing ΔFHA-, FHA-2D-, ΔMRE11- and ΔATM-NBS1 mutants (G, graph). Bar graphs present the mean and STDEV from three independent experiments. Statistical analysis was performed using Student's t-test. (H) Inhibition of ATM kinase activity limits micronuclear DNA end resection, and this is epistatic with NBS1. Bar graphs show the frequency of micronuclei harboring either BrdU alone, cGAS alone, BrdU and cGAS or neither in BEAS2B-shSCR + DMSO, BEAS2B-shSCR + ATM inhibitor, BEAS2B-shNBS1 + ATM inhibitor, NBS-WT NBS1 + DMSO, NBS-Vector + DMSO and NBS-Vector + ATM inhibitor cells at 24 h after exposure to 2.5 Gy IR. Bar graphs present the mean and STDEV from three independent experiments. Statistical analysis was performed using Student's t-test. * P ≤ 0.05; ** P ≤ 0.01; *** P ≤ 0.001; **** P ≤ 0.0001.

