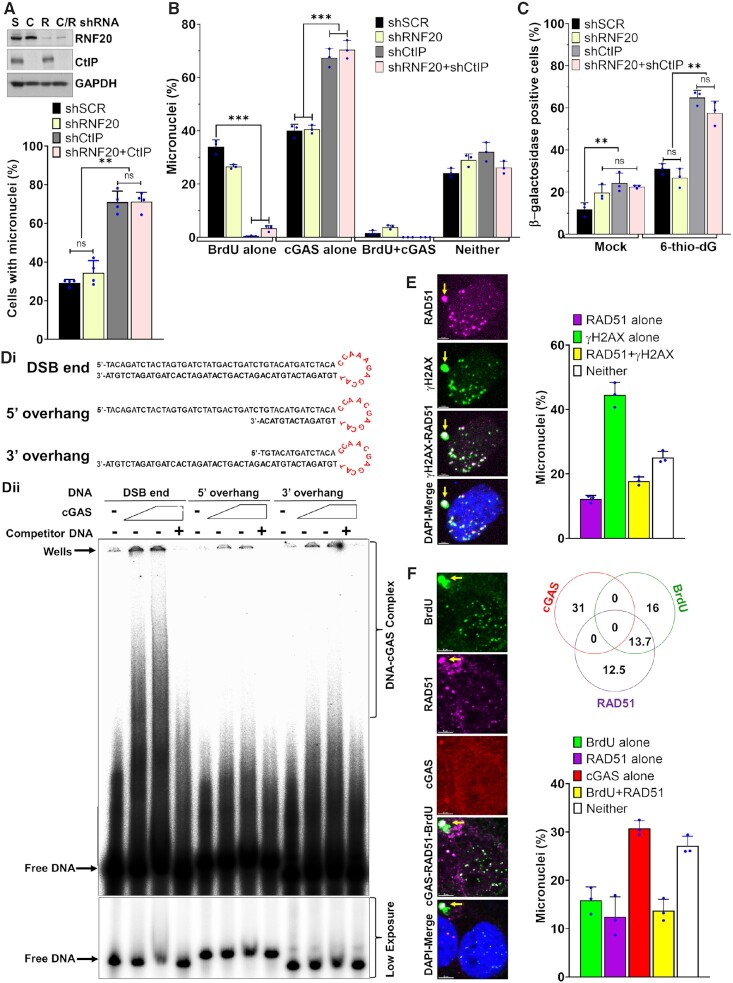
Figure 6.
CtIP-mediated end resection attenuates cGAS binding to micronuclear DNA. (A–C) Downregulation of CtIP enhances cGAS-positive micronuclei. Representative western blots show expression of CtIP and RNF20 in BEAS2B cells stably expressing shSCR (S), shCtIP (C), shRNF20 (R) and shCtIP + shRNF20 (C/R) (A, top). Bar graphs show percentages of cells with micronuclei (A); percentages of micronuclei harboring either cGAS alone, BrdU alone, cGAS and BrdU or neither (B) in BEAS2B cells stably expressing scrambled (SCR), shRNF20, shCtIP and shRNF20 and shCtIP at 24 h after exposure to 2.5 Gy IR. Bar graph shows percentages of β-galactosidase–positive cells expressing scrambled (SCR), shRNF20, shCtIP and shRNF20 and shCtIP RNAs at 10 days after exposure to 2.5 Gy IR (C). Bar graph presents the mean and STDEV of three independent experiments. Statistical analysis was performed using two-way ANOVA. (D) cGAS binds with double-stranded but not end-resected DNA substrates. Schematic shows the three different DNA structures used for the in vitro cGAS binding assay (i). Representative phosphor-image shows cGAS binding with double-stranded but not with end-resected DNA substrates (ii). 5–10 μM cGAS was incubated with 50 fmol 32P–labeled DNA substrates in the presence or absence of 100 bp cold double-stranded DNA (competitor). DNA protein complex was resolved onto 5% native polyacrylamide gel electrophoresis, and the signal was detected by phosphor-imaging. (E) RAD51 is recruited to micronuclear DNA, and it co-localizes with γH2AX. Representative images show co-localization of RAD51 and γH2AX in the same micronuclei (left) and the bar graph shows the percentages of either RAD51 alone, γH2AX alone, RAD51 and γH2AX or neither in HT1080 cells at 24 h after exposure to 2.5 Gy IR. Data in the bar graph represent mean and STDEV from three independent experiments. (F) RAD51 and cGAS do not co-localize in the same micronuclei. Representative images show localization of cGAS, RAD51 and BrdU signal in the micronuclei of BEAS2B cells at 24 h after exposure to 2.5 Gy IR. Venn diagram and the bar graph show the percentages of micronuclei with indicated markers. Data in the Venn diagram and the bar graph represent mean and STDEV from three independent experiments. * P ≤ 0.05; ** P ≤ 0.01; *** P ≤ 0.001.

