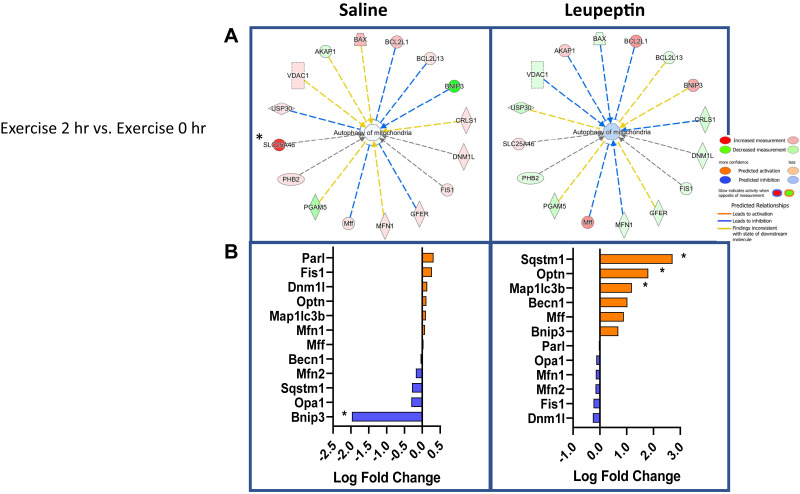
Figure 6.
Dynamic mitophagy protein changes after exercise. Ingenuity pathway analysis (IPA) comparing the 2 h and 0 h exercise cohorts (n = 5/group) (A). Log-fold changes in mitophagy proteins were compared between the 2-h and 0-h postexercise cohorts (B). A log-fold increase represents enhanced protein content in the 2 h compared to the 0 h groups. *P < 0.05 when comparing 2 h treadmill running (EX) to 0 h EX.

