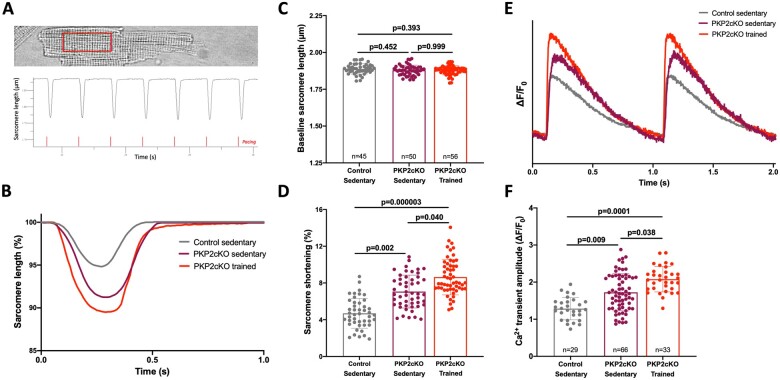
Figure 4.
Sarcomere length and calcium transient measurements in cardiac myocytes of sedentary and trained PKP2cKO mice. (A) Top: Example of cell region of interest (red square). Bottom: Example of sarcomere length recording, collected in Ionoptix, and analysed with IonWizard. Red lines highlight electrical stimulation; cells were paced for 20–30 s before the start of the recording to achieve steady-state. (B) Exemplary sarcomere shortening traces from sedentary control (grey line), sedentary PKP2cKO (purple line), and trained PKP2cKO myocytes (red line) 21 days post-TAM injection (21 dpi). (C and D) Baseline sarcomere length (C) and sarcomere shortening (D) in sedentary control (grey bar and symbols), sedentary PKP2cKO (purple bar and symbols), and trained PKP2cKO myocytes (red bar and symbols) 21 dpi. Numbers inside bars in C indicate number of cells and apply to both C and D panels. (E) Examples of electrically evoked Ca2+ transients in PKP2cKO myocytes 21 dpi, maintained at room temperature and in standard Tyrode solution. Grey: Myocyte from sedentary control mouse. Purple: Myocyte from sedentary PKP2cKO mouse 21 dpi. Red: Myocyte from trained PKP2cKO mouse 21 dpi. (F) Average Ca2+ transient amplitude in sedentary control (grey bar and symbols), sedentary (purple bar and symbols), and trained (red bar and symbols) PKP2cKO myocytes 21 days dpi. Numbers inside bars indicate number of cells. Data from 4 to 5 mice per group, presented as mean ± SD. Statistical tests: Hierarchical test was used for all parameters (details in Methods section).

