Figure 5.
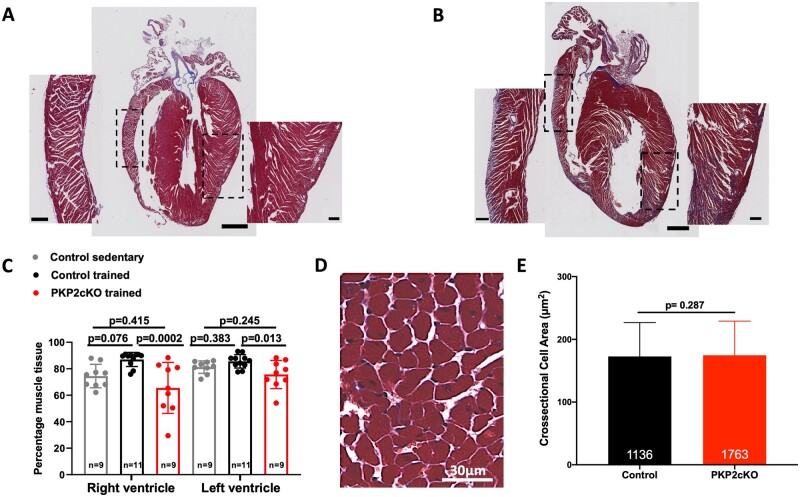
Effect of 6-week training on cardiac histology. (A and B) Examples of Masson Trichrome stained longitudinal axis sections of a control (A) and a PKP2cKO trained heart (B). Scale bars: 1000 µm. Dotted squares indicate area showed at higher magnification on the respective sides. Scale bars: 200 µm. (C) Percentage of healthy muscle tissue detected by Masson Trichrome staining of control sedentary (grey bars and symbols), control trained (black bars and symbols), and PKP2cKO trained (red bars and symbols). Number of hearts indicated inside each bar. One-way analysis of variance. (D) Representative example of left ventricular histology section of PKP2cKO trained heart used for cross-sectional area analysis. (E) Cross-sectional area of left ventricular myocytes in control (black bars) and trained PKP2cKO mice (red bars). Number of cells measured per group is noted inside each bar (from n = 10 control and n = 7 PKP2cKO mice, respectively). Mann–Whitney U test for non-parametric samples. Individual symbols are not shown given the total n values included (over 1000 per bar).

