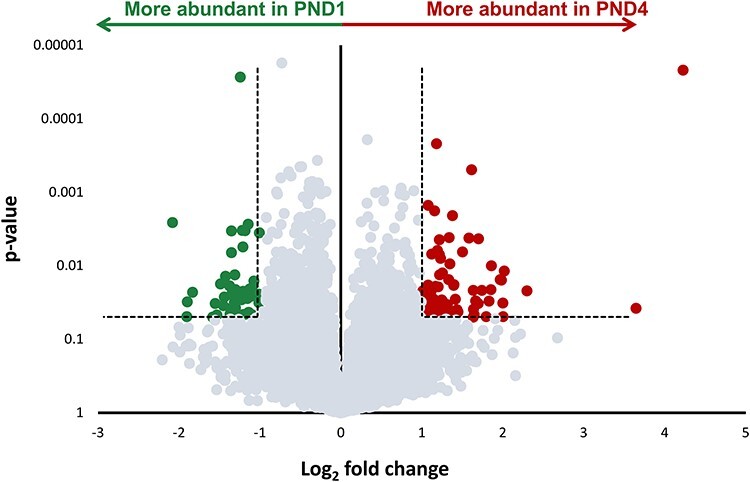
Figure 1.

Differential gene expression profiling of neonatal mouse granulosa cells. The volcano plot indicates the differential expression between RNA transcripts from postnatal day 1 (PND1), and postnatal day 4 (PND4) granulosa cells (n = 4 replicates from each group). Mapped genes expressed in higher abundance in PND1 granulosa cell RNA transcripts compared to PND4 granulosa cells are colored green. Genes expressed in higher abundance in PND4 granulosa cells compared to PND1 are colored red. Dashed line indicates the threshold for differential expression; genes with high statistical significance (P ≤ 0.05), and log2 fold change of greater than ±1. Points that fall below these thresholds are colored grey.
