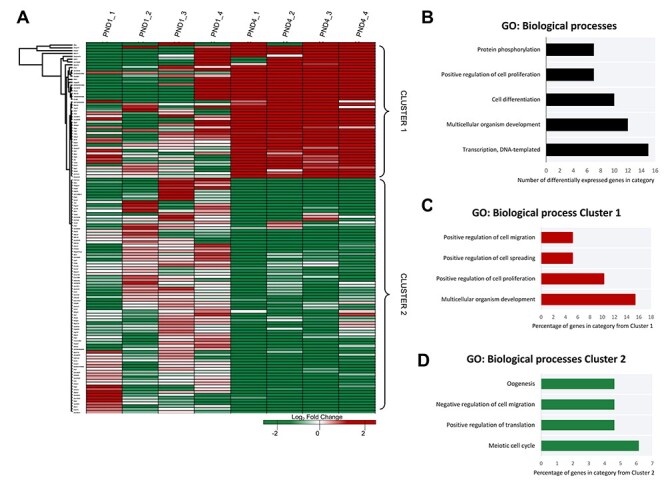
Figure 2.

Gene expression clustering of neonatal mouse granulosa cells. (A) A heatmap differential expression within the defined threshold (P ≤ 0.05, log2 fold change of ± ≥ 1, n = 131) depicts the consistency of expression of mapped transcripts identified as having significant between biological replicates. Different genes are represented in different rows, and different replicates in different columns. Expression values (fragments per kilobase million) are represented as a color scale from green for lower expressions to red for higher expressions and normalized to the average FPKM for the PND1 group. Differentially expressed genes were annotated via gene ontology (GO) analysis in DAVID (v6.8). (B) GO information of the biological process categories with highest count of genes from the differentially expressed genes. Clusters of differential expression were identified from the heat map and annotated via gene ontology (GO) analysis in DAVID (v6.8). (C) GO information of four biological process categories from Cluster 1 are presented as the percentage of genes from within that cluster belonging to a given category, and similarly (D) the GO information of biological process categories from Cluster 2 for four notable categories with the greatest percentage. For full list of DAVID GO terms and identifiers returned for this dataset, see Supplementary Material S3.
