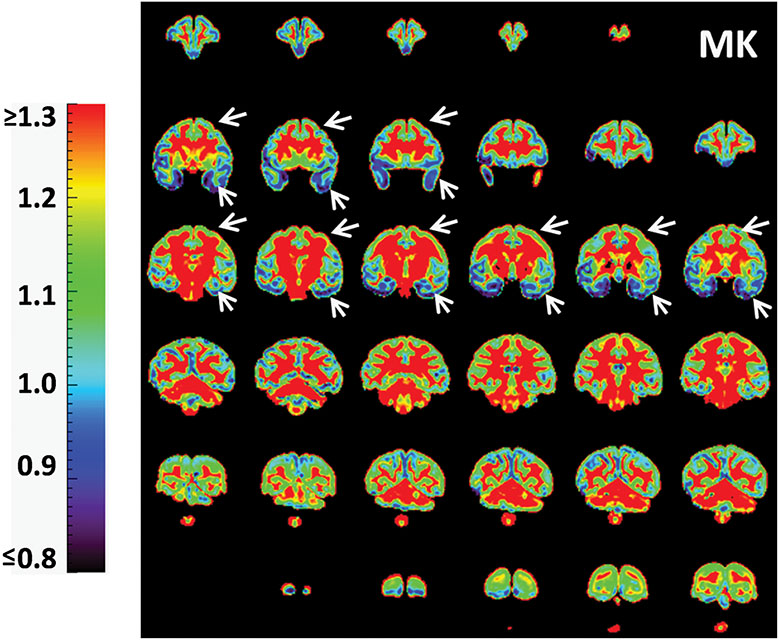
Figure 3:
Coronal MK maps from anterior to posterior from a representative macaque brain (sample #1). Significant MK difference is clear between the temporal cortex (blue regions pointed by white arrows) and prefrontal/precentral-postcentral cortex (yellow-green regions pointed by white arrows). The color bar encodes MK values.

