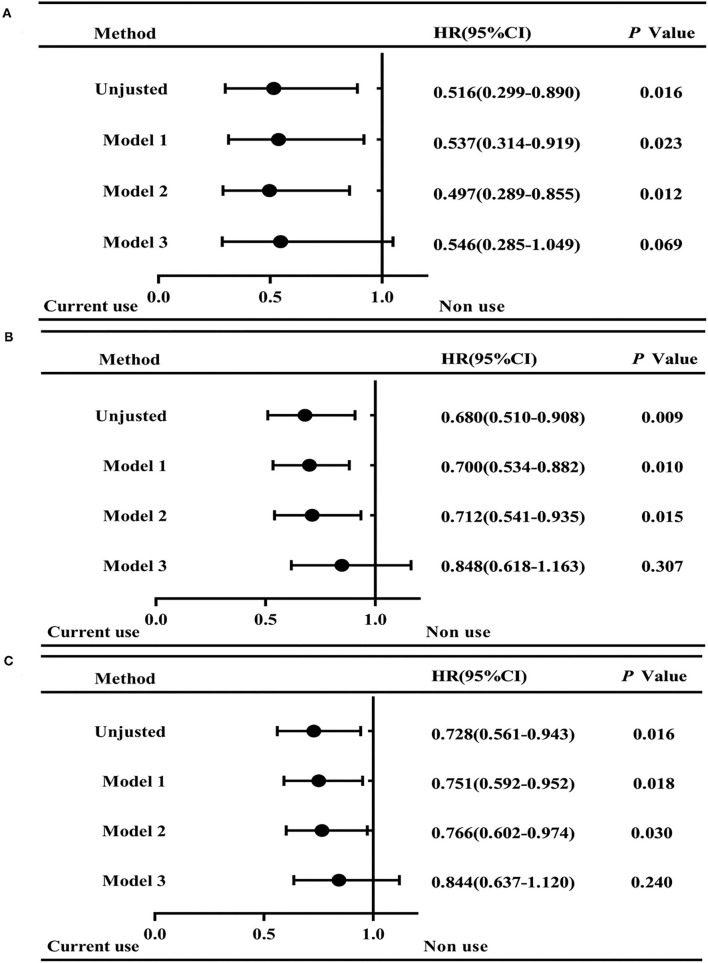
Figure 2.
Hazard ratios (95%CI) for mortality in ICH patients of current antihypertension drug use and non-use. Graphs show forest plots for HR for all-cause mortality at discharge (A), 30 days (B), and 90 days (C) after ICH onset. Model 1: Adjusted for age and gender. Model 2: Adjusted for age, gender, residence, ischemic stroke history, admission SBP and DBP. Model 3: Adjusted for age, gender, residence, ischemic stroke history, admission SBP and DBP, and hematoma volume. HR, hazard ratio. Non-use group is as the Reference. *p < 0.05.

