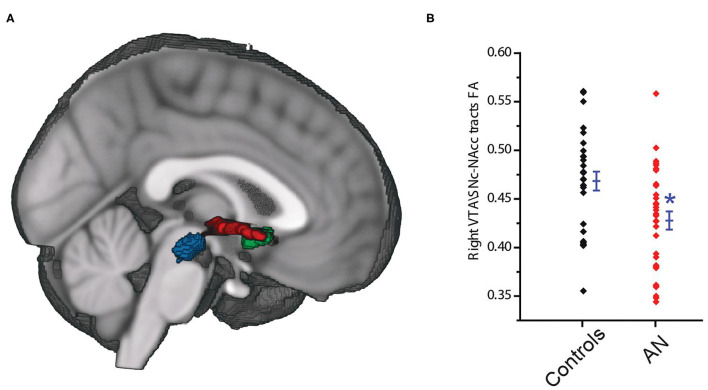
Figure 4.
The VTA\SNc (blue) and the NAcc (green) regions of interest, and the connecting white matter tracts (red) (A). Tracts connecting the right VTA\SNc and right NAcc ROIs showed significantly lower lower average fractional anisotropy (FA) in the AN compared to control group (B). The * symbol indicates statistically significant.

