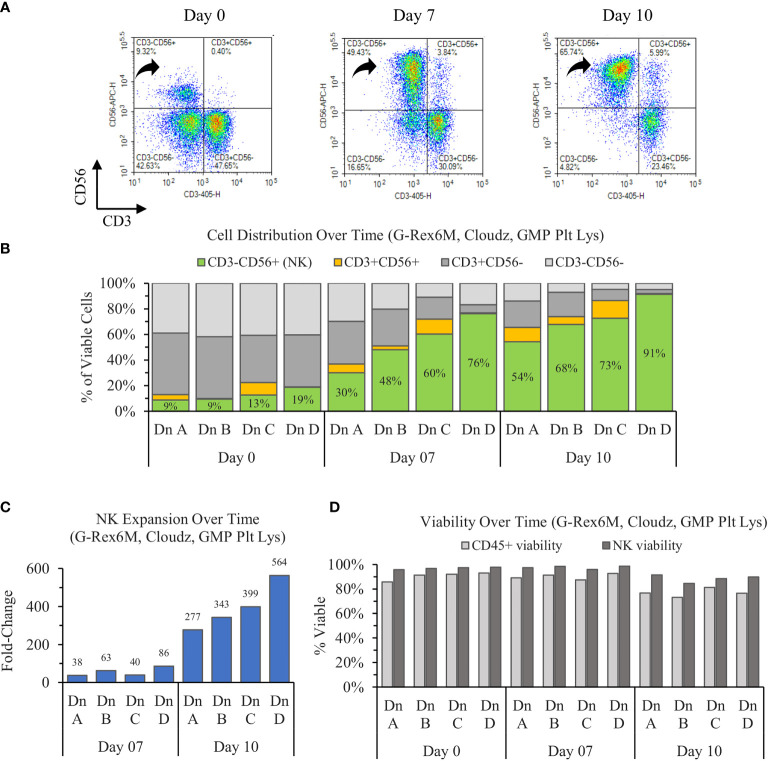
Figure 1.
Ten-day expansion of NK cells from PBMCs with NK Cloudz and GMP human platelet lysate cultured in the G-Rex6M. (A) Flow cytometer density plots at 0, 7, and 10 days compare CD3 and CD56 expression of the expanded cell population. Black arrows indicate CD3−CD56+ (NK) cells, which correspond with the green boxes in (B) the plot of cell distribution of viable CD45+ cells. (C) Viable NK cell fold change relative to day 0. (D) The viability of two populations: the light gray bars represent the viability of all CD45+ cells (including NK cells) and the dark gray bars represent the viability of only the CD45+CD3−CD56+ (NK) population. The graphs are broken out by donor (Dn A, Dn B, Dn C, and Dn D) to highlight the donor variability in the process.

