
Figure 1.
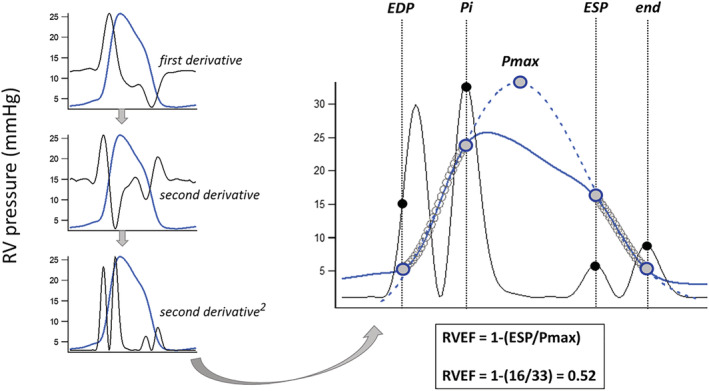
Method derivation for right ventricular ejection fraction (RVEF) estimation from a RV pressure waveform. The signal average for a series of RV pressure waveforms was created (blue line) and its second derivative squared to produce four upright peaks (black lines). These peaks were then used to define the 'up and down’ pressure segments (open circles) for prediction of Pmax, the maximal pressure achieved if the contraction remained isovolumic, as the intervals from half of the first peak (end‐diastolic pressure or EDP) to the second peak (the first inflection point or Pi), and from the third peak (end‐systolic pressure or ESP) to the fourth (end). The third peak approximates the point of maximal time varying elastance (RV pressure/RV volume) with RV pressure at this point regarded as an estimate of true ESP.