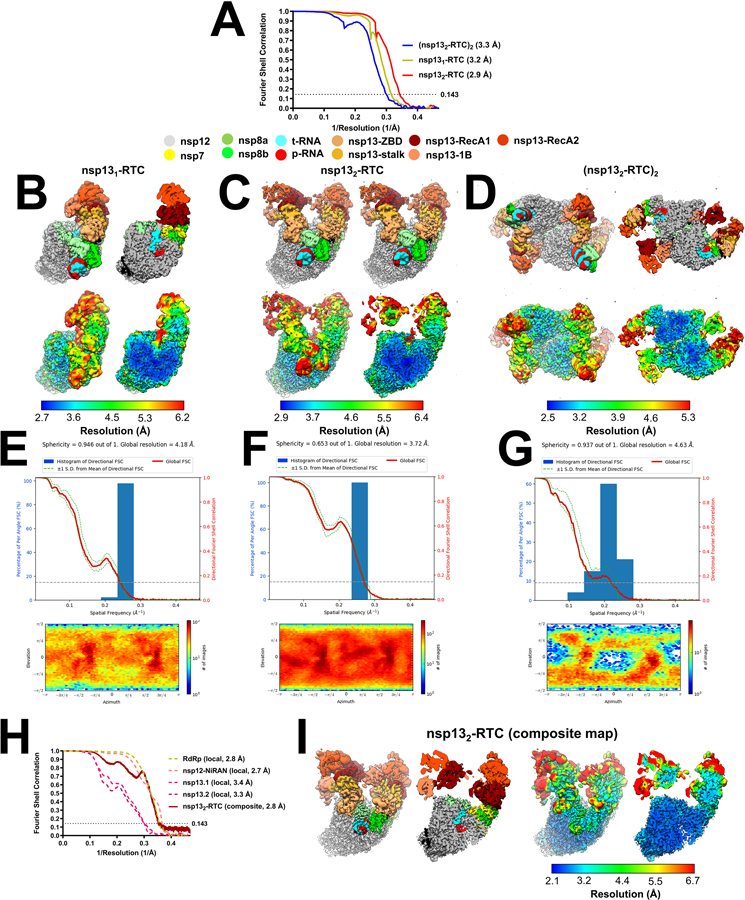
Extended Data Fig. 4 |. Cryo-EM of nsp13-RTC.
A. Gold-standard Fourier-shell correlation (FSC) plot for nsp131-RTC (yellow line), nsp132-RTC (red line), and (nsp132-RTC)2 (blue line) calculated by comparing the independently determined half-maps from cryoSPARC. The dotted line represents the 0.143 FSC cutoff which indicates a nominal resolution of 3.2 Å (nsp132-RTC), 2.9 Å (nsp132-RTC), and 3.3 Å [(nsp132-RTC)2].
B - D. The cryo-EM maps filtered by local resolution 3 are shown. The view on the right is a cross-section.
(top) Colored by subunit (key above).
(bottom) Colored by local resolution (key on the bottom).
B. Nsp131-RTC (map2).
C. Nsp132-RTC (map3).
D. (nsp132-RTC)2 (map4).
E - G. Directional 3D Fourier shell correlation calculated by 3DFSC (top) 4 and particle orientation distribution calculated by cryoSPARC (bottom).
E. Nsp131-RTC.
F. Nsp132-RTC.
G. (nsp132-RTC)2.
H. Gold-standard FSC plots for local-refined maps (dashed lines) and nsp132-RTC composite map (map9) (solid line).
I. The nsp132-RTC composite map (map9) filtered by local resolution 3.
(left) Colored by subunit.
(right) Colore by local resolution (key at the bottom).

