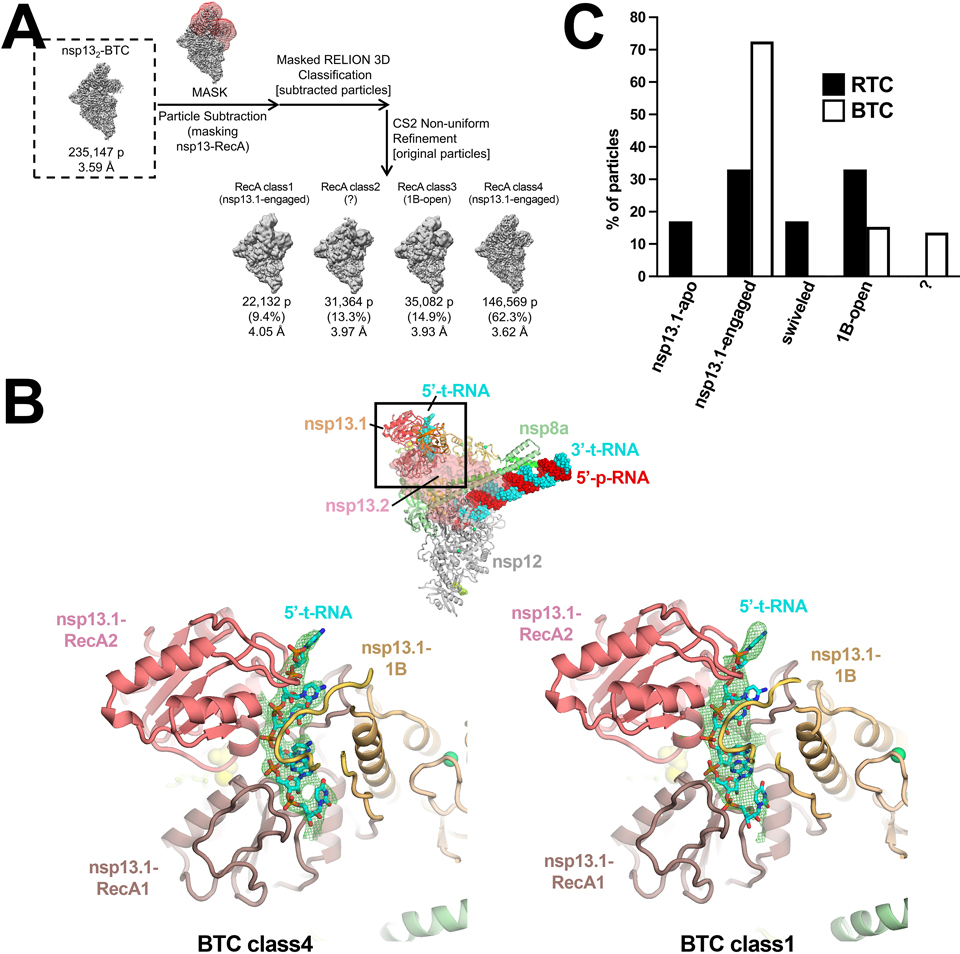
Extended Data Fig. 8 |. Classification pipeline for the nsp132-BTC dataset and comparison of nsp132-RTC and nsp132-BTC class distribution.
A. Focused classification pipeline for nsp132-BTC dataset 6.
B. (top-middle) View of the nsp132-BTC-class4. Proteins are shown as backbone ribbons except nsp13F is shown as a transparent surface. The RNA is shown as spheres. The boxed region is magnified in the views below.
(bottom) Magnified views of the nsp13T RNA binding channel for nsp132-BTC-class4 (left) and nsp132-BTC-class1 (right). The downstream single-stranded t-RNA is shown as sticks. Cryo-EM difference densities for the downstream single-stranded t-RNA are shown (green mesh).
C. Histogram illustrating the nsp132-RTC particle distribution for the nsp132-RTC (black bars) and nsp132-BTC (white bars).

