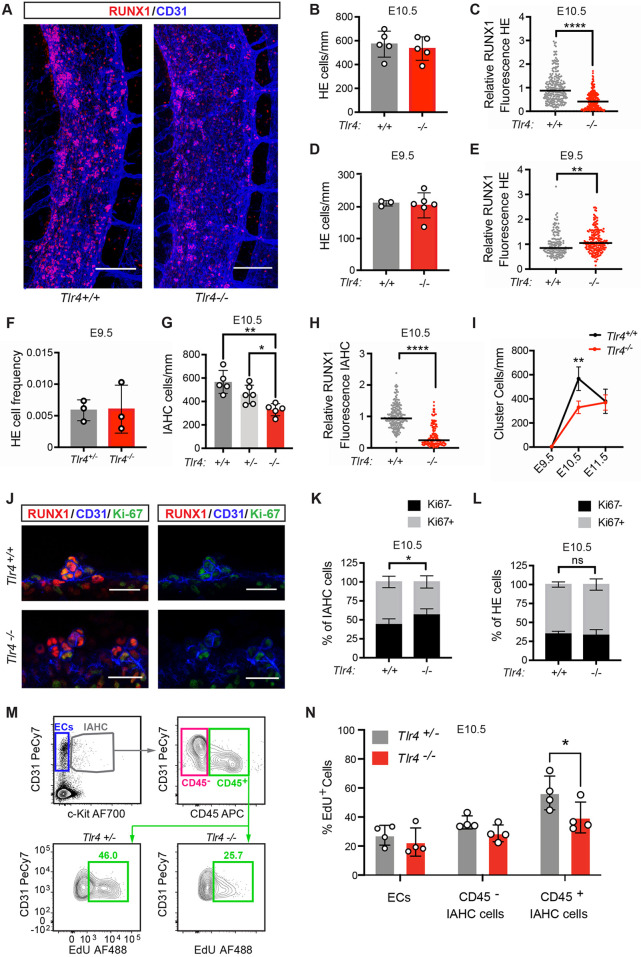
Fig. 1.
TLR4 signaling increases the number and proliferation of IAHC cells but does not regulate the number of HE cells. (A) Representative images of confocal z-projections (interval=2 µM) of the dorsal aorta (DA) of E10.5 Tlr4+/+ (left) or Tlr4−/− (right) embryos immunostained for RUNX1 (red) and CD31 (blue). Scale bars: 100 µm. (B) Quantification of HE cells (CD31+RUNX1+KIT−) per mm length of the DA in immunostained E10.5 embryos. Data are mean±s.d.; each point represents one embryo; Student's t-test, unpaired, two-tailed; n=5 per genotype. The area counted centered on the intersection of the vitelline artery with the DA, and all cells within two or three somite pairs in both the rostral and caudal direction were counted. (C) Corrected total cell fluorescence (CTCF) was calculated to measure RUNX1 intensity in HE cells, identified as described in B. An integrated density value for each HE cell was measured using FIJI software and CTCF was calculated as [integrated density of cell−(area of selected cell×mean intensity of background)]. CTCF values were then normalized using the CTCF average for Tlr4+/+ HE cells (relative RUNX1 fluorescence). Horizontal lines indicate the mean, with individual data points plotted; Student's t-test, unpaired, two-tailed; n=248 for Tlr4+/+ and n=258 for Tlr4−/− with cells measured from three embryos per genotype. (D) Quantification of HE cells/mm at E9.5 in the DA of Tlr4+/+ and Tlr4−/− embryos. Cells were counted in the region spanning the caudal boundary of the heart to the intersection with the umbilical artery. Data are mean±s.d.; Student's t-test, unpaired, two-tailed; n=3 and 6 for Tlr4+/+ and Tlr4−/−, respectively. (E) CTCF values, indicating RUNX1 intensity, measured for HE cells in immunostained E9.5 Tlr4+/+ and Tlr4−/− embryos. Horizontal lines indicate the mean, with individual data points plotted; Student's t-test, two-tailed; n=141 for Tlr4+/+ and n=192 for Tlr4−/− with ∼40-50 cells measured from at least three embryos per genotype. (F) Frequency of HE cells within sorted ECs (CD31hiCD144+ESAM+CD44+CD45−Ter119−Mac1−CD41−) isolated from E9.5 Tlr4+/− and Tlr4−/− embryos, determined by plating limiting numbers of cells (≤5/well) on OP9 stromal cells. Tlr4+/− embryos generated from a cross of Tlr4+/− and Tlr4−/− mice were used in lieu of Tlr4+/+ embryos in order to generate a sufficient number of cells for the analysis. All embryos were 21-25 somite pairs. Plates were scored by eye for hematopoietic growth and positive wells were confirmed by flow cytometry (positive wells were CD45, CD41, Mac1, B220 and/or Ter119 positive). The frequency is the number of positive wells/total ECs plated. Data are mean±s.d.; Student's t-test, unpaired, two-tailed. Data are from three independent experiments with more than 500 cells sorted per genotype for each experiment. (G) Quantification of IAHC cells/mm (CD31+RUNX1+KIT+) in confocal images of E10.5 DAs from Tlr4+/+, Tlr4+/− and Tlr4−/− embryos. Data are mean±s.d.; one-way ANOVA and Tukey's multiple comparison test, n=5 or 6 embryos per genotype. (H) RUNX1 intensity determined by CTCF in IAHC cells in the DA measured as described in C. n=223 for Tlr4+/+ and n=157 for Tlr4−/− with approximately 50-60 cells measured from three or four embryos per genotype. Horizontal lines indicate the mean, with individual data points plotted. (I) Quantification of IAHC cells/mm (CD31+RUNX1+KIT+) in confocal images of E9.5, E10.5 and E11.5 DAs from Tlr4+/+ and Tlr4−/− embryos. Data are mean±s.d.; two-way ANOVA, Sidak correction for multiple comparisons, n=3 for E9.5 genotypes, n=5 for E10.5 genotypes, n=3 for E11.5 Tlr4+/+ and n=4 for E11.5 Tlr4−/−. (J) Confocal z-projections (2 µm intervals, four intervals total/image) of IAHC cells in E10.5 DAs of Tlr4+/+ (top row) and Tlr4−/− (bottom row) embryos immunostained for RUNX1 (red), CD31 (blue) and Ki67 (green). Scale bars: 25 µm. (K) Percentage of Ki67+ (gray) and Ki67− (black) IAHC cells, calculated as (Ki67+/− subset/total IAHC cells), observed in confocal images of E10.5 DAs of Tlr4+/+ and Tlr4−/− embryos. Data are mean±s.d.; two-way ANOVA, Sidak correction for multiple comparisons; n=6 or 7 per genotype. (L) Percentage of Ki67+ (gray) and Ki67− (black) HE cells, calculated as described in K. (M) Representative flow cytometry plots depicting gating for CD31+KIT− endothelial cells (ECs), CD31+KIT+CD45− IAHC cells and CD31+KIT+CD45+ IAHC cells. EdU labeling of CD45+ IAHC cells (bottom row) are shown for Tlr4+/− and Tlr4−/− embryos. Tlr4+/− embryos generated from a cross of Tlr4+/− and Tlr4−/− mice were used in lieu of Tlr4+/+ embryos in order to obtain a sufficient number of cells for the analysis. The number of IAHC cells in Tlr4+/− and Tlr4+/+ embryos was not significantly different, as shown in G. Cells in plots were previously gated on FSC versus SSC, live, lineage negative, CD41lo/− (see Fig. S1B). Images are representative of three independent experiments (four litters). Littermates were pooled in each experiment. (N) Percentage of EdU+CD31+KIT− endothelial cells (ECs), CD31+KIT+CD45− IAHC cells and CD31+KIT+CD45+ IAHC cells determined by flow cytometry. Data are mean±s.d.; two-way ANOVA, Sidak correction for multiple comparisons; n=4 pooled litters per genotype. Representative of three independent experiments. *P≤0.05, **P≤0.01, ****P≤0.0001, ns indicates not significant.

