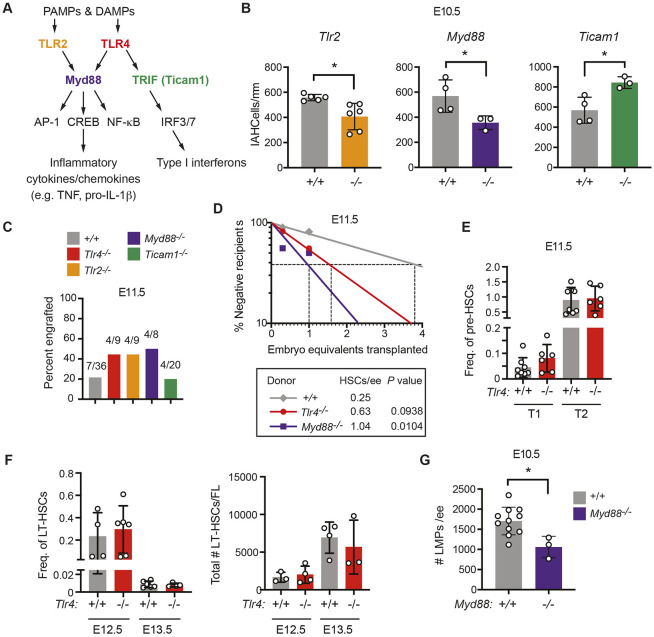
Fig. 2.
MyD88-dependent TLR signaling increases the number of LMPs in the AGM region but limits the number of HSCs. (A) TLR signaling pathway highlighting cell surface receptors TLR2 and TLR4, their adaptors MyD88 and TRIF, and transcription factor effectors. (B) Quantification of CD31+RUNX1+KIT+ IAHC cells/mm in the DA of E10.5 embryos from confocal images. n=3-6 per genotype. Data are mean±s.d. Unpaired, two-tailed Student's t-test. Each dot represents one embryo. (C) Percentage of recipient mice (CD45.1+) exhibiting multi-lineage reconstitution following transplantation of one embryo equivalent (ee) of AGM regions from E11.5 embryos (CD45.2+). Multi-lineage reconstitution was assessed as >1% donor myeloid (Mac1+, Mac1+Gr1+), T-cells (CD3+) and B-cells (CD19+) in the peripheral blood 16 weeks post-transplantation (see Fig. S2A for details of flow cytometric analysis). (D) Quantification of HSCs in E11.5 wild-type (+/+), Tlr4−/− and MyD88−/− embryos by limiting dilution transplantation of 0.3 and 1.0 ee cells from the AGM region, umbilical and vitelline arteries (CD45.2+) into CD45.1+ adult recipients. Data are representative of at least eight recipients per group from seven transplants. The number of HSCs was calculated using ELDA software (Hu and Smyth, 2009). (E) Frequency of phenotypic type I (CD31+KIT+CD41loCD45−Ter119−) (T1) or type II (CD31+KIT+CD41loCD45+Ter119−) (T2) pre-HSCs in Tlr+/+ and Tlr4−/− E11.0 AGM regions measured by flow cytometry. Freq. represents the frequency of the population within live cells. All embryos were between 39 and 44 somite pairs. Data are mean±s.d.; one-way ANOVA and Tukey's multiple comparison test, n=8 for Tlr4+/+ and n=6 for Tlr4−/−. Data are representative of two independent experiments. Each dot represents one embryo. (F) Frequency and total number of phenotypic LT-HSCs at E12.5 and E13.5 within the fetal liver (FL) determined by flow cytometry. Freq. represents the frequency of the population within live cells. LT-HSCs were defined as CD150+CD48−KIT+Sca-1+Lin− (Lin includes B220, CD3, Gr-1, Nk1.1, Ter119). Total numbers of LT-HSCs are calculated from frequencies and the total numbers of cells in each FL. Data are mean±s.d.; one-way ANOVA and Tukey's multiple comparison test; E12.5, n=4 for Tlr4+/+ and n=6 for Tlr4−/−; E13.5, n=6 for Tlr4+/+ and n=4 for Tlr4−/−. Each dot represents one embryo. Representative of three independent experiments for both E12.5 and E13.5. (G) Frequency of LMPs in E10.5 +/+ and Myd88−/− embryos (n=11, n=3, respectively) determined by plating dissociated cells from the AGM region, umbilical and vitelline arteries in limiting dilution on OP9 and OP9-DLL1 stromal cells. +/+ embryos include offspring from intercrosses of mice heterozygous for mutations in other inflammatory mediators. The total number of progenitors that generated B cells when cultured on OP9 stromal cells and progenitors that generated T cells on OP9-DLL1 cells are plotted. Numbers of B and T cells were calculated using ELDA software (Hu and Smyth, 2009). Representative of at least three independent experiments. Data are mean±s.d. Unpaired, two-tailed Student's t-test. Each dot represents one embryo.*P≤0.05.

