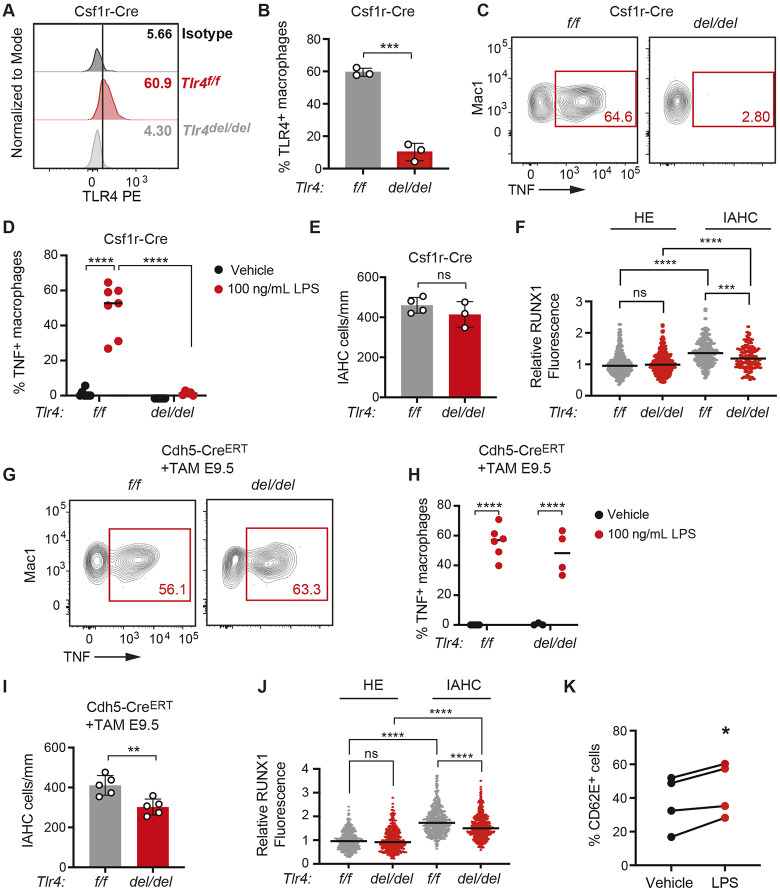
Fig. 3.
TLR4 signaling is required in endothelial and/or IAHC cells to promote IAHC cell numbers. (A) Representative histograms showing TLR4 surface expression on macrophages (CD45+Mac1+F4/80+Ter119−) in E10.5 Tlr4f/f (f/f) and Tlr4f/f;Csf1r-Cre embryos (del/del) compared with an isotype control. See Fig. S3A for gating strategy. (B) Percentage of TLR4+ macrophages (CD45+Mac-1+F4/80+) measured by flow cytometry in E10.5 Tlr4f/f (f/f) and Tlr4f/f;Csf1r-Cre embryos (del/del). Data are mean±s.d.; three independent experiments with pooled littermates; unpaired, two-tailed Student's t-test. (C) Representative flow plots of TNF+ macrophages following ex vivo stimulation of E10.5 Tlr4f/f and Tlr4f/f;Csf1r-Cre embryos with LPS. See Fig. S3B for gating strategy. (D) Percentage of TNF+ macrophages in E10.5 Tlr4f/f and Tlr4f/f;Csf1r-Cre embryos treated ex vivo with vehicle or LPS, determined by flow cytometry. Horizontal lines indicate the mean, with individual data points plotted; two-way ANOVA with Sidak's correction for multiple comparisons; n=5-7. Representative of three independent experiments. (E) Quantification of CD31+RUNX1+KIT+ IAHC cells in the DA of E10.5 Tlr4f/f and Tlr4f/f;Csf1r-Cre embryos. n=3. Data are mean±s.d. Unpaired, two-tailed Student's t-test. Each dot represents one embryo. Unpaired, two-tailed Student's t-test. (F) CTCF measuring RUNX1 intensity in HE and IAHC cells in E10.5 Tlr4f/f and Tlr4f/f;Csf1r-Cre embryos. Relative RUNX1 fluorescence was analyzed as described in Fig. 1C. HE cells, n=378 and 333; IAHC cells, n=209 and 119 for Tlr4f/f and Tlr4f/f;Csf1r-Cre, respectively. Horizontal lines indicate the mean, with individual data points plotted. Unpaired, two-tailed Student's t-test. (G) Representative flow plots of TNF+ macrophages in Tlr4f/f and Tlr4f/f;Cdh5-Cre embryos following ex vivo stimulation with LPS. Dams were injected with tamoxifen (TAM) at E9.5. (H) Percentage of TNF+ macrophages in vehicle and LPS-stimulated explanted E10.5 Tlr4f/f and Tlr4f/f;Cdh5-CreERT AGM regions. n=3-6. Representative of two independent experiments. Horizontal lines indicate the mean, with individual data points plotted. Two-way ANOVA with Sidak's correction for multiple comparisons. (I) Quantification of IAHC cells (CD31+RUNX1+KIT+) in E10.5 Tlr4f/f and Tlr4f/f;Cdh5-CreERT embryos. n=5. Data are mean±s.d. Each dot represents one embryo. Unpaired, two-tailed Student's t-test. (J) RUNX1 intensity in HE and IAHC cells in E10.5 Tlr4f/f and Tlr4f/f;Cdh5-CreERT embryos, determined as described in Fig. 1C. HE, n=389 and 739; IAHC, n=454 and 789 cells for Tlr4f/f and Tlr4f/f;Cdh5-CreERT, respectively. Horizontal lines indicate the mean, with individual data points plotted. Unpaired, two-tailed Student's t-test. (K) Percentage of CD62E+ ECs measured by flow cytometry following a 6 h stimulation of FACS-purified ECs with LPS (100 ng/ml). Data represent four independent experiments. Paired Student's t-test, two-tailed. *P≤0.05, **P≤0.01, ***P≤0.001, ****P≤0.0001, ns indicates not significant.

