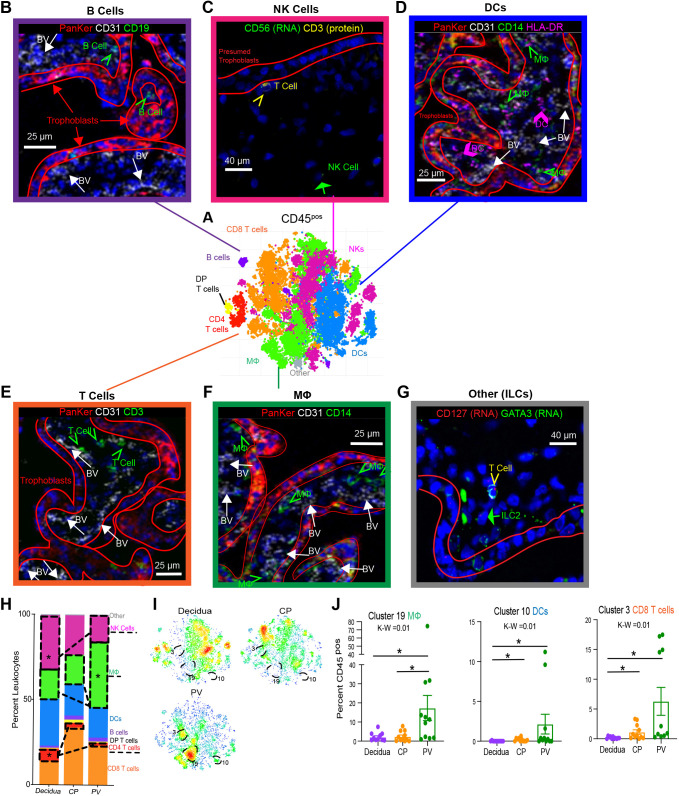
Fig. 2.
Global immune landscape of second trimester placenta. (A) Merged t-distributed stochastic neighbor embedding (t-SNE) of CD45pos cells from maternal decidua (n=11), CP (n=11) and PV (n=11) from PhenoGraph clustering of CyTOF data. (B) IMC identifying B cells (green arrows) located within the trophoblast boundary (red outlines) and outside the fetal blood vessels (BV) (white arrows). PanKer, pan-keratin (stains for trophoblasts). (C) Dual in situ hybridization and IF identifying NK cells (green arrow) distinct from T cells (yellow arrowhead) in PV. (D) IMC identifying DCs (pink arrows) and HLA-DRpos macrophages (green arrows). (E) IMC identifying T cells (green arrows). (F) IMC identifying macrophages (green arrows). (G) Dual in situ hybridization and IF identifying ILC2s (green arrow) distinct from T cells (yellow arrowhead) in PV. (H) Stacked bar graph summarizing all clusters belonging to the same immune subsets from CyTOF data. (I) Density plot of the populations shown in A segregated by tissue of origin. Clusters significantly enriched in the PV are outlined. (J) Quantification of PV-enriched cluster abundance. K-W, Kruskal–Wallis test. *P<0.05 following post-hoc analysis. Graphs show mean±s.e.m. Mφ, macrophage.

