Fig. 3.
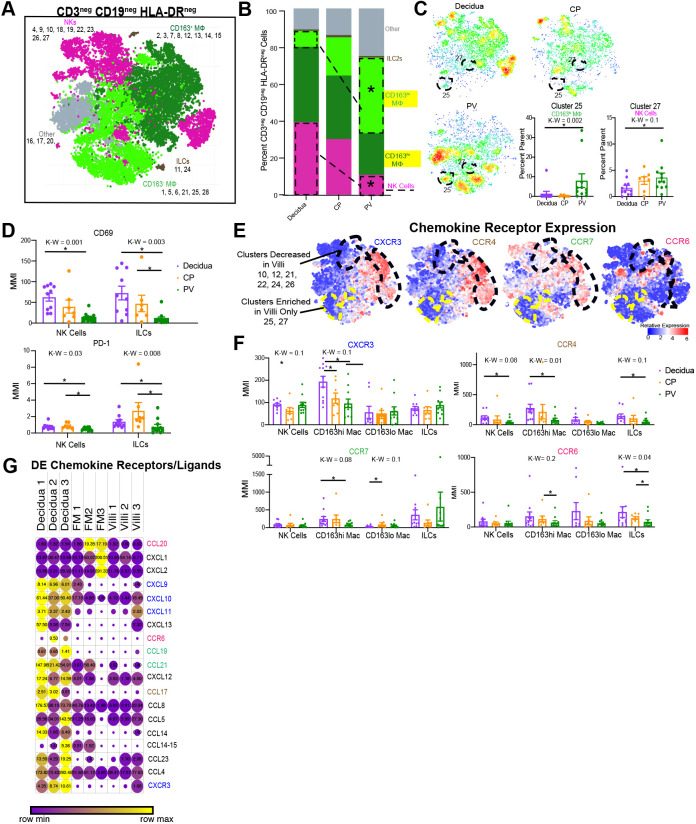
Innate HLA-DRneg cells in PV. (A) Combined CyTOF t-SNE for CD45pos CD3neg CD19neg HLA-DRneg cells (n=12). (B) Stacked bar graph showing the abundance of major immune subtypes. (C) Density plots separated by tissue of the cell populations shown in A. Statistically significantly abundant clusters in the PV are outlined. Graphs show cumulative data of PV-abundant clusters (outlined in the density plots). (D) MMI of CD69 (top) and PD-1 (bottom) for 2D-gated NK and ILC populations. (E) Expression heatmaps for chemokine receptors mapped to the cells identified in A. (F) MMIs of chemokine receptors on innate cell subsets from 2D gating. (G) Expression from RNAseq of differentially expressed chemokine ligand/receptor genes between tissues (n=3). Circle size indicates expression value, and circle color reflects relative expression across row. Differentially expressed genes were determined as: P<0.05, false-discovery rate<20% and fold change>absolute value 2. *P<0.05 upon post-hoc analysis after Kruskal–Wallis (K-W) test. DE, differentially expressed. Graphs show mean±s.e.m. Mac, macrophages.

