Fig. 5.
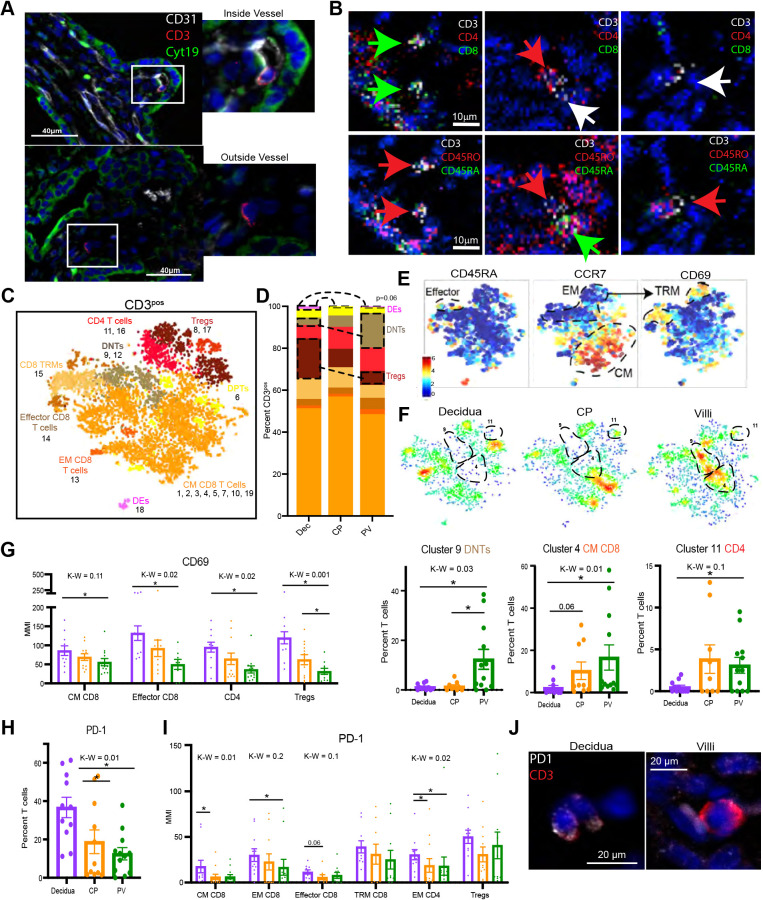
T cell subsets in placental tissues. (A) Representative images of T cells inside (top) and outside (bottom) fetal vasculature (CD31) in PV. (B) IMC images of T cell subtypes in PV. Green arrows indicate CD8pos (top) or CD45RApos (bottom), red arrows indicate CD4pos (top) or CD45ROpos (bottom) and white arrows indicate CD3pos (T cells). (C) Cumulative CyTOF t-SNE for PV, CP and decidua CD45pos CD3neg HLA-DRpos cells. (D) Stacked bar graph showing the abundance of major immune subtypes. (E) Relative expression of memory T cell markers in the PV cell populations shown in C. (F) Density plot separated by tissue of origin (C). Statistically significantly abundant clusters in the PV are outlined. Graphs show cumulative data of PV-abundant clusters (outlined in density plots). (G) MMI of CD69 from 2D gating of populations. (H) Abundance of PD-1pos T cells by 2D gating. (I) PD-1 MMI from 2D-gated subsets. CyTOF analysis starting at n=12 for each analysis; see Table S5 for omitted cases. (J) PD-1 expression on T cells in PV and decidua. *P<0.05 upon post-hoc analysis after Kruskal–Wallis (K-W) test. CM, central memory; EM, effector memory; TRM, tissue-resident memory. Graphs show mean±s.e.m.

