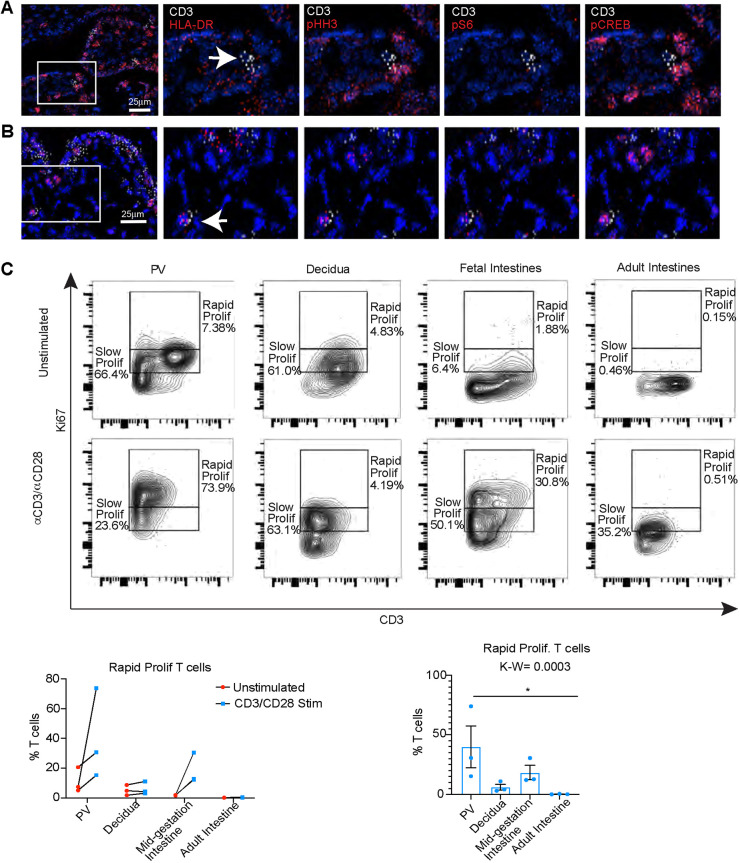
Fig. 6.
T cell activation in PV. (A) IMC images of inactive T cells in PV. (B) IMC images of activated T cells in PV. In A,B, boxed areas are shown at higher magnification in images to the right. Arrows indicate CD3pos (T cells). (C) Flow plots (top) and quantification (bottom) for proliferating (Ki67hi) T cells after stimulation across the tissues indicated. n=3 (all experiments). Graphs show mean±s.e.m.

