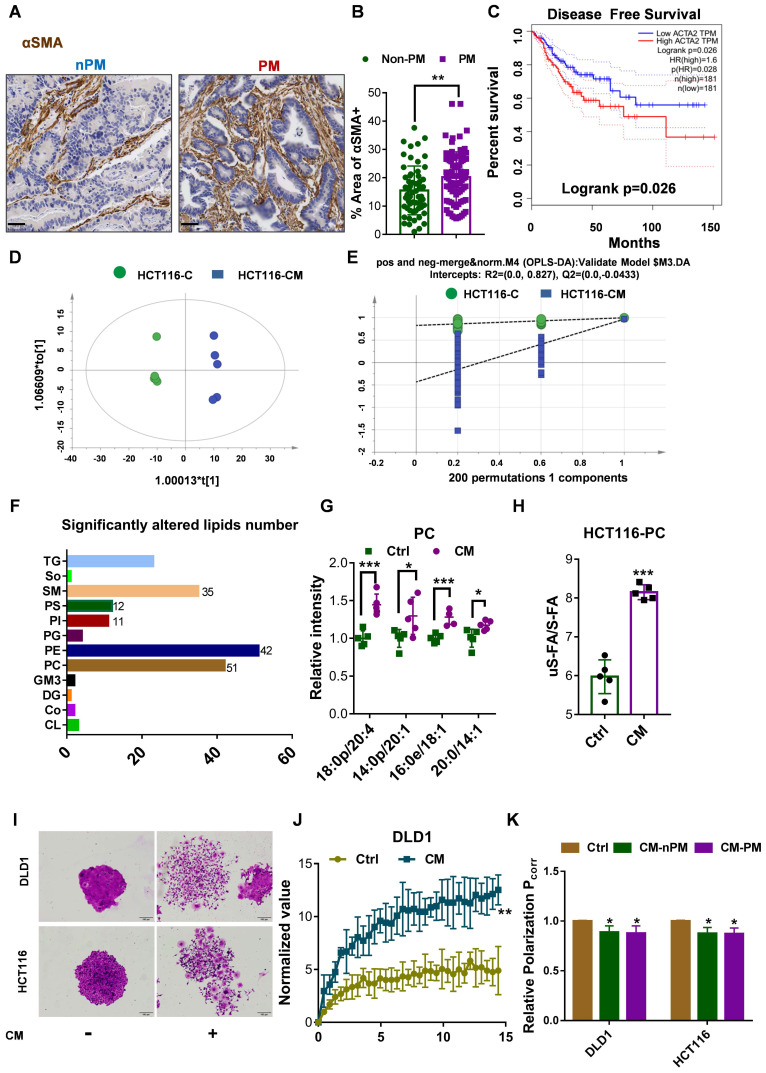
Figure 2.
CAFs increases unsaturated fatty acid chains and membrane fluidity in CRC cells. A, Sections of non-PM and PM colorectal tumor tissue were stained for αSMA. Representative images from each group. Scale bars, 50 µm. B, Comparison of αSMA+ areas in non-PM (n=59) and PM (n=83) colorectal tumor tissue samples by IHC. C, Disease-Free Survival curves for colon and rectal adenocarcinoma patients were plotted with data from the TCGA database. The median cutoff point for αSMA (ACTA2) expression was used. There were 181 patients with low expression (the blue curve) and 181 with high expression (the red curve). D, Score plots are shown for the control (green) versus CAF-CM (blue) treated from the OPLS-DA model. n=5. E, Permutations are shown for the control (green) versus the CAF-CM-treated (blue) from the OPLS-DA model. n=5. F, Numbers of lipids whose abundance was significantly altered in CAF-CM-incubated HCT116 cells. n=5. G, Distributions of PC with unsaturated acyl chains in CAF-CM-incubated HCT116 cells. n=5. H, Ratios of unsaturated to saturated acyl chains in CAF-CM-incubated HCT116 cells. n=5. I, Clonogenic formation in CRC cells with or without CAF-CM incubation. After approximately 14 days of incubation, the colonies were stained with crystal violet and then imaged using an inverted microscope. Representative data are shown. J, Normalized fluorescence recovery curve of DLD1 cultured with control/conditioned medium. n = 3. K, Fluorescence polarization in CRC cells incubated in CAF-CM. n =3. Bars, mean ± SD. *p < 0.05, **p < 0.01.

