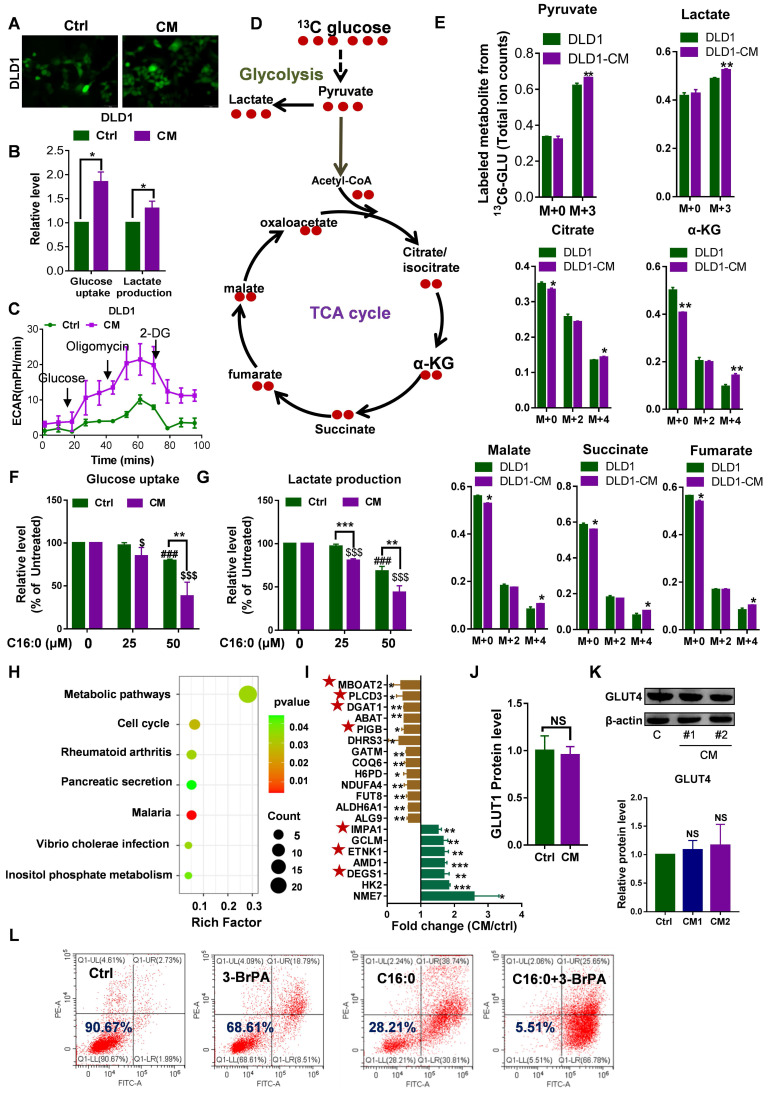
Figure 4.
Increased membrane fluidity induced by CAFs can accelerate glucose metabolism. A, Glucose uptake in DLD1 cells incubated with CAF-CM or control medium visualized by 2-NBDG fluorescence. n=3. B, Relative levels (% of control) of glucose uptake and lactate production in DLD1 cells after incubation with CAF-CM. n=3. C, Impact of CAF-CM incubation on the extracellular acidification rate (ECAR, an indicator of lactate production from glycolytic metabolism) as determined by Seahorse analyzer. n = 2 independent experiments with similar results. D, Schematic illustration of glucose recycling using U-13C-glucose and tracing analysis. DLD1 cells were incubated with or without CAF-CM for 48 h. Then, cells were cultured in U-13C-glucose-containing DMEM for 24 h to synthesize U-13C metabolites. E, U-13C metabolites were analyzed. n=3. F, Glucose uptake and G, lactate production in CAF-CM-treated DLD1 cells cultured in the absence or presence of C16:0 (concentration from 0 to 50 µM). n=3. H, The metabolic pathway was highly enriched in CAF-CM-treated DLD1 cells by proteomics analysis. All pathways displayed had a P value < 0.05. I, Fold changes in the expression of metabolic pathway proteins determined by proteomics analysis. Brown bars indicate downregulated proteins; green bars indicate upregulated proteins. Those proteins labeled with a star are involved in phospholipids and sphingolipid metabolism. J, The protein level of GLUT1 in CAF-CM-treated DLD1 cells determined by proteomics analysis. n=3. K, The protein level of GLUT4 in CAF-CM-treated DLD1 cells determined by Western blotting. n = 3. L, The viability of DLD1 cells incubated with CAF-CM after 48 h of incubation with 3-BrPA was assessed by annexin-V/PI assay. The value in each panel indicates the % of surviving cells. n = 2 independent experiments with similar results. Bars, mean ± SD. *p < 0.05, **p < 0.01.

