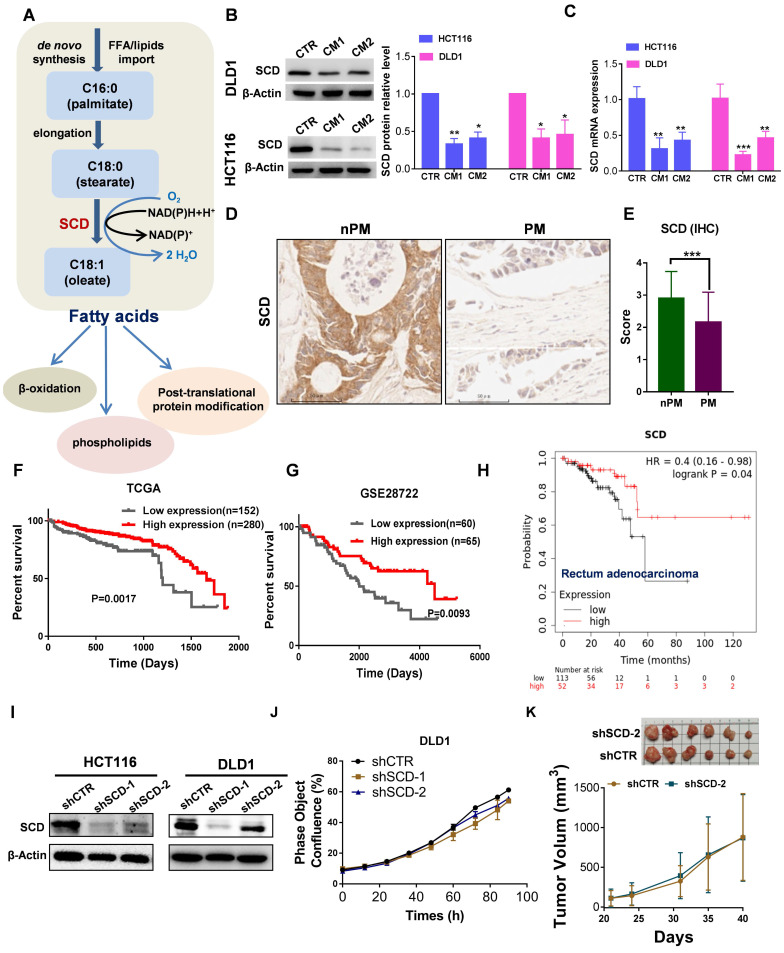
Figure 5.
Low expression of SCD is associated with poor prognosis in patients with CRC and PM-CRC. A, Schematic representation of fatty acid synthesis and function. B, Western blot showing SCD expression in DLD1 and HCT116 cells incubated with CAF-CM. C, RT-qPCR was performed to measure the mRNA level of SCD in DLD1/HCT116 cells incubated with CAF-CM. D-E, Comparison of SCD protein expression by IHC (D). Magnification, ×200. Representative images from each group are shown. Staining scores for SCD in non-PM (n = 70) and PM (n = 56) tissues (E). F, Kaplan-Meier curves showing the 5-year survival rate of CRC patients from TCGA cohorts partitioned by the relative abundance of SCD (high/low expression). G, Kaplan-Meier curves showing overall survival of CRC patients from the GEO (GSE28722) cohort partitioned by the relative abundance of SCD (high/low expression). H, Survival curves were plotted for rectal adenocarcinoma patients (n = 165) using the Kaplan-Meier Plotter Database. The software autoselected the best cutoff point for SCD expression. There were 113 patients with low expression (the black curve) and 52 with high expression (the red curve). HR, hazard ratio. I, Western blot showing the efficiency of SCD knockdown. Anti-SCD antibody (1:1000 dilution; Affinity Biosciences, OH, USA). J, The proliferation rate of DLD1low-SCD cells evaluated by phase object confluence (%) with IncuCyte ZOOM. n=3. K, The shCTR- or shSCD-2-transfected HCT116 cells (3.5*10^6 per mouse) were subcutaneously inoculated into Balb/C nude mice. Upon termination of the experiment, the tumors were isolated and photographed, n=6. Bars, mean ± SD. *p < 0.05, **p < 0.01, ***p < 0.001.

