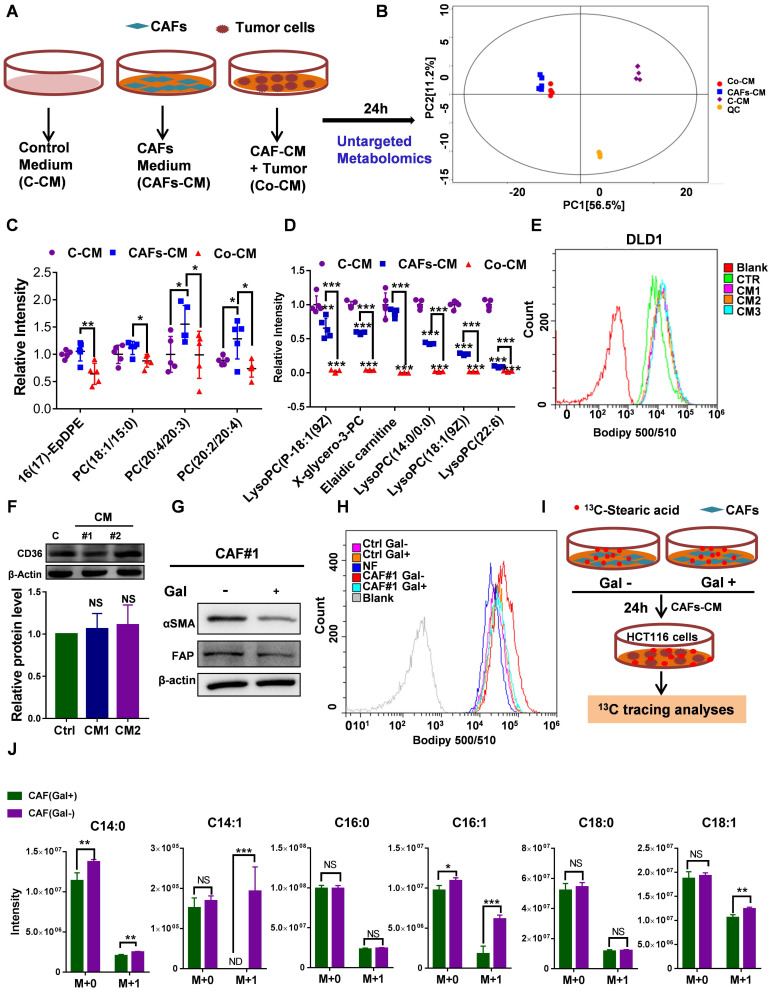
Figure 6.
Uptake of CAF-derived lipids by CRC through increased membrane fluidity. A, An experimental schematic of the method used to collect the supernatant for nontarget metabolomics analysis. B, Score plots are shown for control medium (purple) versus CAFs-CM (blue) and CAF-CM+ HCT116 cells (Co-CM) (red) treated from the OPLS-DA model. C, Relative intensity of significantly increased lipid molecules secreted by CAFs but consumed by HCT116 cells, n=5. D, Relative intensity of significantly decreased lipid molecules in HCT116 cells incubated with the supernatant of CAFs-CM, n=5. E, The indicated treated CRC cells were incubated with BODIPY 500/510 to analyze the lipid uptake by flow cytometry. F, Western blot showing CD36 expression in DLD1 cells incubated with CAF-CM. Anti-CD36 antibody (1:1000 dilution; Affinity Biosciences, OH, USA). G, Western blot showing αSMA and FAP expression in CAFs treated with Galunisertib (10 µM). Anti-αSMA antibody (1:1000 dilution; Cell Signaling Technologies, MA, USA); Anti-FAP antibody (1:1000 dilution; Abcam, Cambridge, MA, USA). H, The DLD1 cells treated with indicated CM were incubated with BODIPY 500/510 to analyze lipid uptake by flow cytometry. I, An experimental schematic of the method used to collect the supernatant for fatty acid tracing analyses (U-13C- stearic acid). J, 13C labeled fatty acids in HCT116 cells were analyzed. n=4. Bars, mean ± SD. *p < 0.05, **p < 0.01, NS: not statistically significant, ND: not detected.

