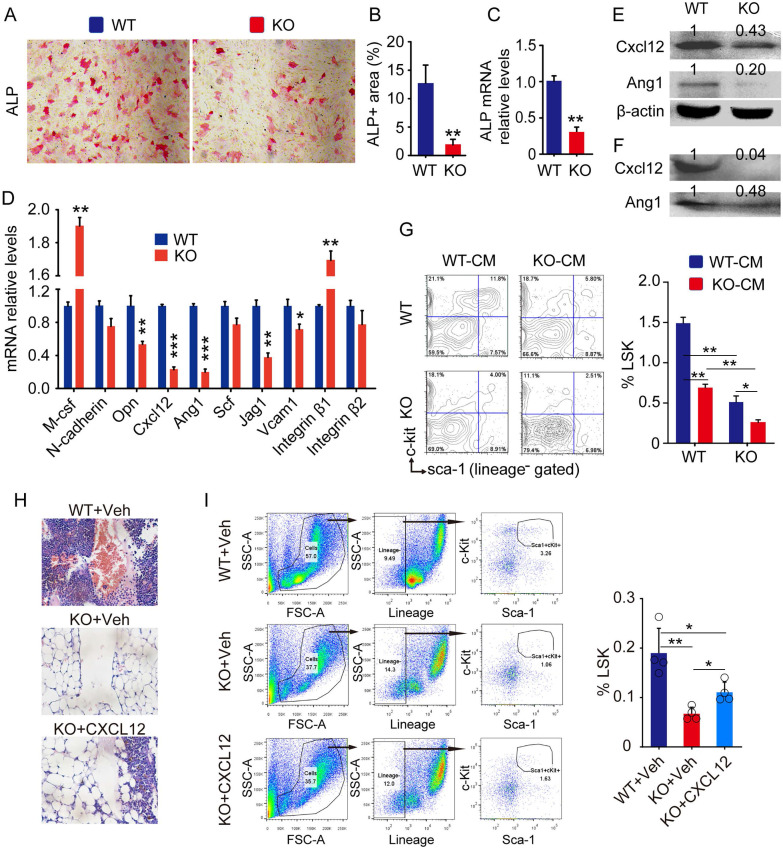
Fig 2.
Defects of HSPC niche composed by osteoblastic cells in Bmi1 KO mice. (A) 3rd passage of bone-derived mesenchymal progenitor cells (BdMPC) from 4-week-old WT and KO mice treated in osteoblast induction medium containing β-glycerophosphate and ascorbic acid for 4 days before ALP staining. ALP+ osteoblasts shown in red after ALP staining. (B) The percentage of ALP+ cell area versus total cell growth area was counted. n=3 samples. (C) Alp gene transcription levels in bulk mRNA from 3rd passage of BdMPCs treated with osteoblast induction medium for 4 days in (A). n=3 samples. (D) Gene transcription levels of niche factors, including macrophage colony-stimulating factor (M-csf), N-cadherin, osteopontin (Opn), Cxcl12, Angiopoietin 1 (Ang1), stem cell factor (Scf), Jagged 1 (Jag1), Vcam1, integrin β1 and β2, in 3rd passage of BdMPCs from 3-week-old WT and KO mice were tested by qPCR. n=3 samples. (E-F) Protein levels of cellular (E) and secreted (F) CXCL12 and Ang1 were measured in cellular protein lysates and condensed medium supernatant from 3rd passage of BdMPCs by WB, respectively. (G) WT and KO BM cells were cultured in conditioned medium for 48 h before flow analysis. Conditioned medium (CM): Mixture of 50% (v/v) fresh culture medium with 50% conditioned medium collected from WT or KO BdMPC culture. The bar graph in right panel shows frequencies of LSK cells in cultured BM cells. n=4 samples. (H) Representative H&E-stained tibial paraffin sections from WT and KO mice with intratibial injection of vehicle or CXCL12. n=4 mice. (I) Flow analysis of LSK cells in BM of mice in Fig. H. *p<0.05, **p<0.01, ***p<0.001. Data are mean ± SD; Unpaired two-tailed Student t test in (B), (C) and (D). One-way ANOVA with Tukey's post-hoc test in (G) and (I).

