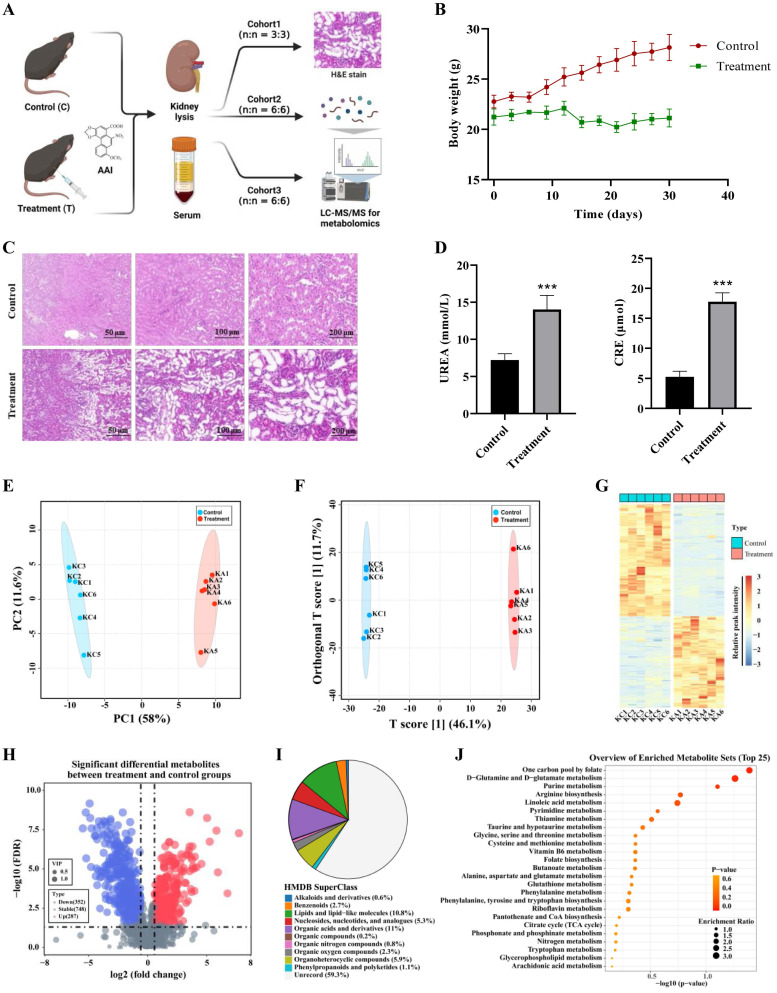
Figure 4.
Metabolomics reveals AA-induced nephrotoxicity mainly through purine metabolism, amino acids metabolism and TCA cycle. (A) The strategy for metabolomics on AAI-induced nephrotoxicity. (B) Body weight from AAI-treated (treatment group) and control group mice. (C) Representative H&E staining in the kidneys of AAI-treated and control mice. (D) Biochemical indicators for UREA and CRE in the serum of mice. (E) The PCA plots of the DMSO and AAI-treatment groups in the kidney, *** P < 0.001, compared with control (n=5). (F) Ortho PLS-DA analysis of the DMSO and treatment groups in the kidney. (G) Heatmap showing top up and down metabolites in the kidney after AAI-treatment. (H) The volcano map displays the different metabolites in the kidney after AAI-treatment. Up-regulated metabolites were represented by red dots, down-regulated metabolites were represented by blue dots. (I) Classification information of HMDB database annotations in the kidney after AAI-treatment. (J) KEGG biochemical metabolic pathway and signal transduction pathway in the kidney after AAI-treatment.

