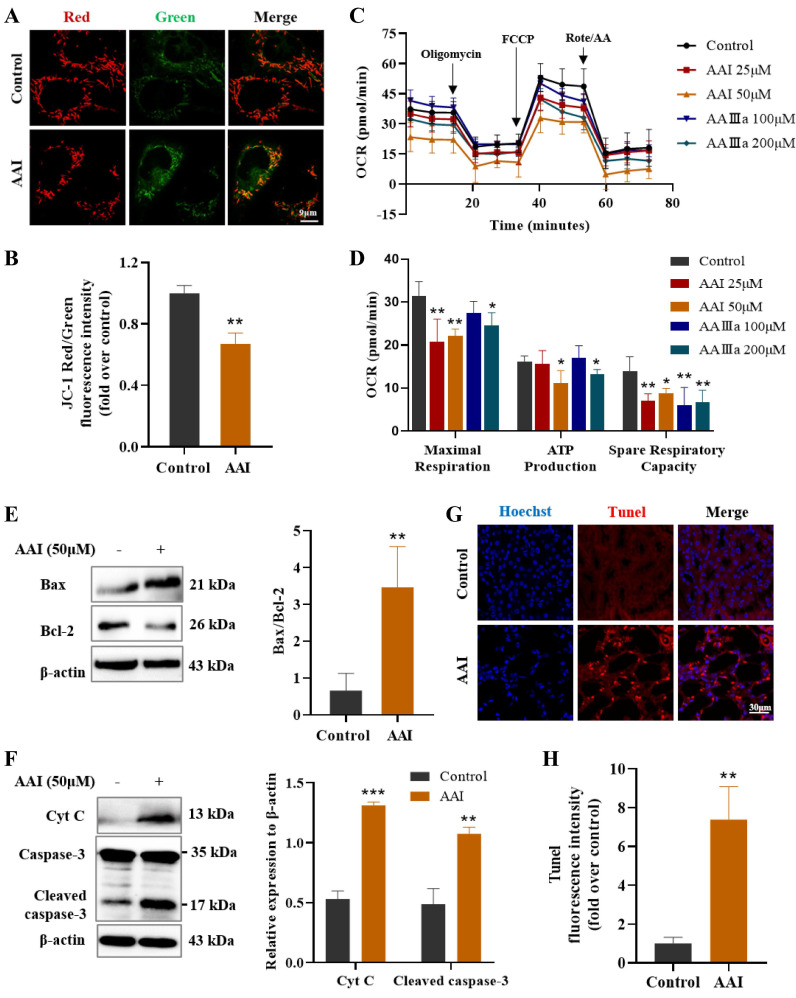
Figure 5.
Mitochondrial dysfunction caused by AAI-induced metabolism disorder and apoptosis. (A) The JC-1 staining for mitochondrial membrane potential, scale bar = 9 µm. (B) Fluorescence intensity quantitative statistics correspond to Figure 5A. (C) The determination of oxygen consumption rate (OCR). (D) The indicators of OCR including maximal respiration, ATP production and spare respiratory capacity. (E) The indicators of mitochondrial apoptosis Bax and Bcl-2 proteins by western blotting and quantitative statistics. (F) The indicators of mitochondrial apoptosis Cyt C and caspase-3 proteins by western blotting and quantitative statistics. (G) Tunel staining in the kidneys of mice after AAI treatment, scale bar = 30 µm. (H) Fluorescence intensity quantitative statistics correspond to Figure 5G. n = 3, *P < 0.05, **P < 0.01, ***P < 0.001 compared with control.

