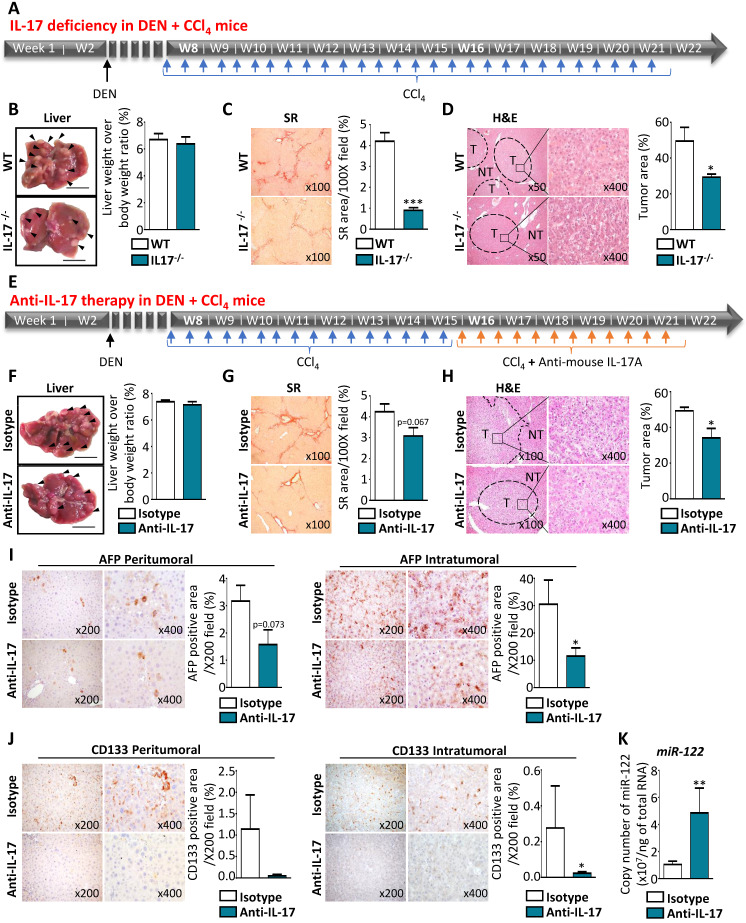
Figure 7.
IL-17-neutralizing strategies reduce tumor growth by limiting CSC occurrence and preventing miR-122 downregulation in vivo. (A) Schematic representation of experimental design used for chronic DEN and CCl4 administration in WT or IL-17-/- mice. (B) Representative macroscopic liver morphology from 22-week-old WT or IL-17-/- mice subjected to the DEN and CCl4 murine model of liver cancer (left panel with scale bars represent 1 mm and arrows show tumor nodules). Quantification of liver weight over body weight ratios (right panel). (C) Representative microphotographs and quantification of Sirius red staining in the liver of WT and IL-17-/- mice. (D) Hematoxylin-Eosin staining allows to highlight non-tumor (NT) and tumor (T) liver tissues at two different magnifications (left x500 and right x400) and quantification of tumor areas in the liver of WT and invalidated mice (right). (E) Experimental design for anti-IL-17 therapy in DEN+ CCl4-induced HCC model. (F) Representative macroscopic liver morphology (scale bar 1 mm and arrows show tumor nodules and liver weight over body weight ratios measure in mice treated by control isotype or anti-IL-17 (right). (G) Sirius red staining (left) and tissue collagen quantification (right) in the liver from mice treated by control isotype or anti-IL-17 antibodies. (H) Representative microphotographs of Hematoxylin-Eosin staining showing non-tumor (NT) and tumor (T) areas, and quantification in mice treated with control isotype or anti-IL-17 antibodies (right). (I) Representative immunohistochemistry staining for AFP and signal quantification in peritumoral or intratumoral areas. (J) Representative CD133 immunostaining and signal quantification in peritumoral and intratumoral areas. (K) Absolute quantification of miR-122 by qPCR. Data represent mean ± SEM and *P<0.05 **P<0.01 mice treated with anti-IL17 (n=7) versus isotype control (n=6) antibody.

