Figure 4.
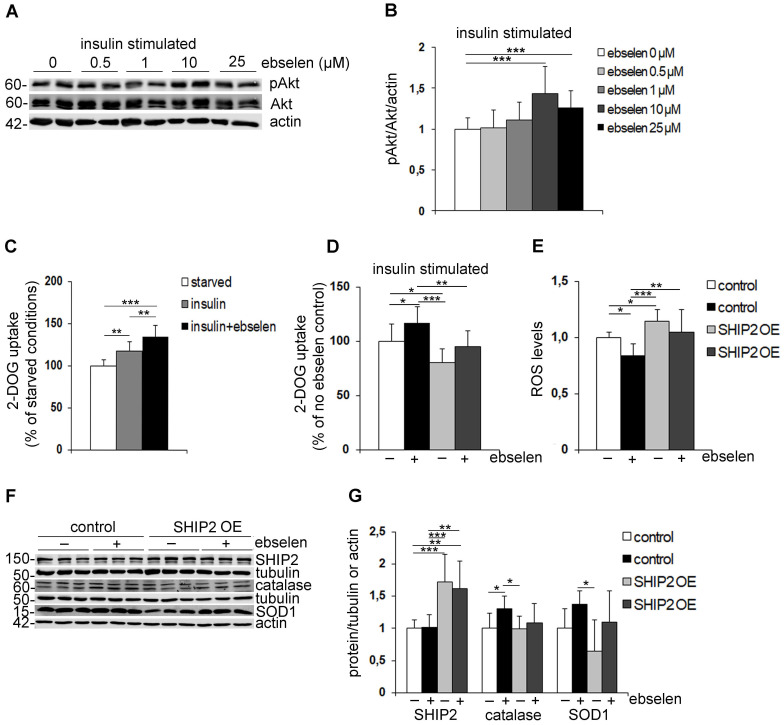
Ebselen enhances insulin signaling, induces glucose uptake, increases the expression levels of antioxidant enzymes and reduces ROS production by inhibiting SHIP2. (A) Representative immunoblots showing that ebselen dose-dependently increases insulin-induced Akt phosphorylation (pAkt) in L6 myotubes. Serum-starved myotubes (20 h) were pretreated for 15 min with ebselen at indicated concentrations or corresponding volume of DMSO as a control followed by stimulation with 10 nM insulin for an additional 15 min. Cell lysates were subjected to immunoblot analysis with anti-Akt, anti-pAkt (Ser 437) and anti-actin IgGs. (B) Quantification of pAkt levels in seven replicate blots as in (A) presented as pAkt/Akt after normalizing to the loading control, actin. (C) Ebselen increases insulin-induced glucose uptake in L6-GLUT4 myotubes. Serum-starved myotubes were pretreated with ebselen (25 µM, 20-24 h) and stimulated with insulin (100 nM, 15 min) followed by the glucose uptake assay. (D) SHIP2 overexpression abrogates the effect of ebselen to induce glucose uptake. L6-GLUT4 myotubes overexpressing SHIP2 by lentiviral infection were treated and glucose uptake performed as described in (C). Graph D legends are the same as in graph E. (E) SHIP2 overexpression abrogates the effect of ebselen to reduce ROS production. L6 myotubes transiently overexpressing SHIP2 were treated with 10 µM ebselen or corresponding volume of DMSO as a control for 20 h and ROS production was detected using DCFH-DA fluorescent probe. Hoechst 33342 was used for normalization. (F) Representative immunoblots show that SHIP2 overexpression partially abrogates the effect of ebselen to increase the expression levels of catalase and SOD1. L6 myotubes transiently overexpressing SHIP2 were treated as described in (E). Cell lysates were subjected to immunoblot analysis with anti-SHIP2, anti-catalase, anti-SOD1 and anti-tubulin or anti-actin IgGs. (G) Quantification of SHIP2, catalase and SOD1 expression levels in three replicate blots as in (F) normalized to the loading controls, tubulin or actin. Data are presented as means ± SD of three-five independent experiments. Student's t test and one- or two-way ANOVA for multiple comparisons. *p ˂ 0.05, **p ˂ 0.01, ***p ˂ 0.001.

