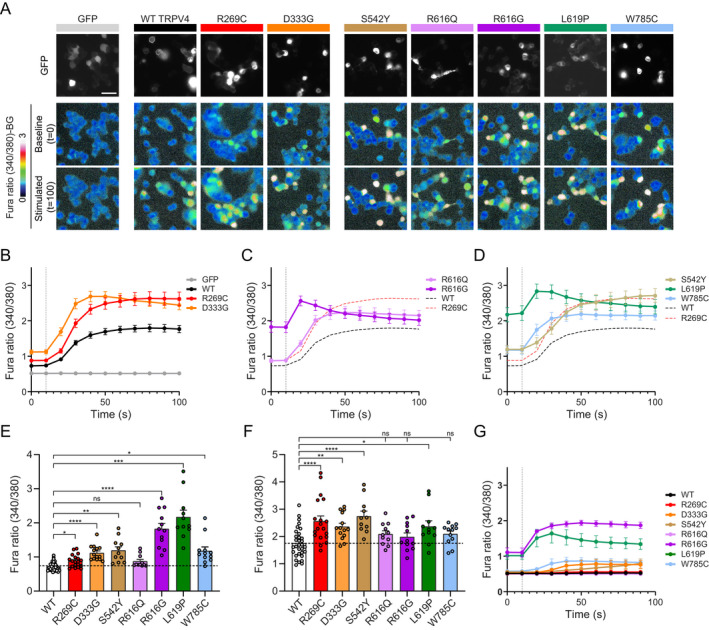
Figure 3.

Severe and mixed phenotype mutants cause marked elevations of baseline calcium levels. (A) Representative images from ratiometric calcium imaging experiments. MN‐1 cells were transfected with GFP‐tagged TRPV4 plasmids and loaded with Fura‐2 AM calcium indicator. Baseline and hypotonic‐stimulated calcium responses were then measured over time. Pathogenic TRPV4 mutants lead to elevated baseline calcium compared to WT TRPV4, whereas baseline calcium levels are more markedly elevated in R616G and L619P TRPV4. (B‐D) Averaged calcium imaging traces before and after hypotonic stimulation, denoted by vertical dashed line. (B) R269C and D333G TRPV4 cause elevated baseline and stimulated calcium influx compared to WT TRPV4. (C) R616G causes marked baseline calcium elevation, whereas R616Q causes only mild elevations. (D) S542Y and W785C TRPV4 cause larger increases in baseline calcium compared to R269C TRPV4. L619P causes marked elevation of baseline calcium similar to R616G. (E) Comparison of baseline calcium levels across all tested TRPV4 mutants. Brown‐Forsythe and Welch ANOVA with Dunnett's post‐hoc test, n = 11–32 independent experiments per condition. (F) Comparison of maximum hypotonic stimulated calcium levels across all tested TRPV4 mutants. One‐way ANOVA with Dunnett's post‐hoc test, n = 11–32 independent experiments per condition. (G) Comparison of calcium imaging traces from cells treated with 50 nM GSK219 and then subjected to hypotonic saline. The R616G and L619P mutants demonstrate retained responses to hypotonic saline stimulation. Data are presented as means ± SEM. *p < 0.05, **p < 0.01, ***p < 0.001, ****p < 0.0001. [Colour figure can be viewed at wileyonlinelibrary.com]
