
Figure 1.
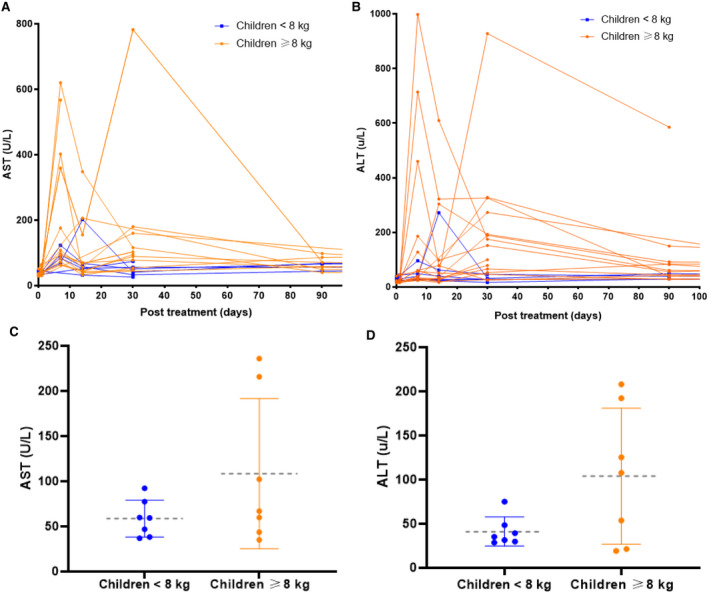
(A) Asparatate aminotransferase (AST) and (B) Alanine Aminotransferase (ALT) (number of times above the upper limit of normal) following onasemnogene dosing. Mean (circles) with standard deviation (dashed grey line) in (C) AST and (D) ALT following onasemnogene dosing. Children weighing ≥8 kg are represented by orange lines and children weighing <8 kg are represented by blue lines. [Colour figure can be viewed at wileyonlinelibrary.com]