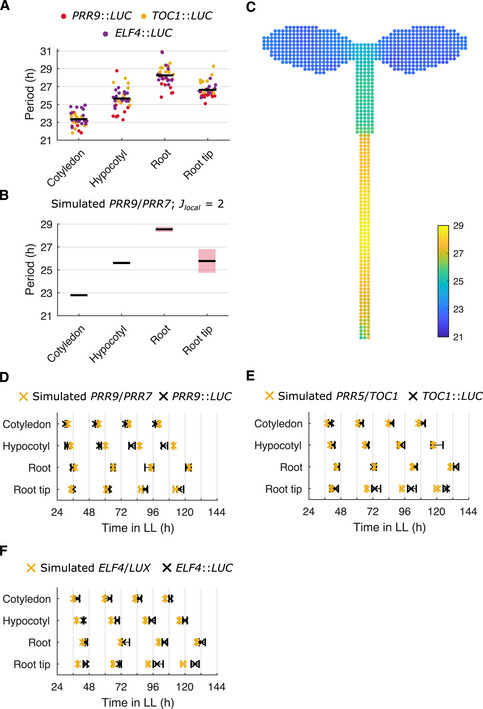
Figure 2. Regional differences in light sensitivity can generate the period structure observed experimentally.

-
APeriod estimates of PRR9::LUC, TOC1::LUC, and ELF4::LUC for different organs imaged under LL. Each data point represents a period estimate from the organ of a single seedling. The horizontal black line shows the mean.
-
B, CPeriod estimates of simulated PRR9/PRR7 expression, measured from regions within the seedling template (B) or individual cells of the seedling template (C). In (B), the black line indicates the mean and the red shaded area one SD of 9 independent simulations. In (C), the color of the cell represents the periods of the individual oscillations. By assuming higher light sensitivity of cells in the cotyledon, hypocotyl, and root tip, the model approximates the period differences observed between regions in experiments. A noise parameter was set to a different value for each region, as informed by single‐cell experiments (Appendix Fig S2). Simulations assumed local cell‐to‐cell coupling (Jlocal = 2).
-
D–FTimes of the final peaks of simulated PRR9/PRR7 and PRR9::LUC (D), simulated PRR5/TOC1 and TOC1::LUC (E), or simulated ELF4/LUX and ELF4::LUC (F), in different organs measured under LL. Simulations assumed varied light sensitivities and local cell‐to‐cell coupling (Jlocal = 2). Data points represent the 25‐th percentile, median, and the 75‐th percentile for the peak times of oscillations scored as rhythmic, n = 9 simulations.
Data information: Experimental data is an analysis of Arabidopsis time‐lapse movies carried out previously (Greenwood et al, 2019). For PRR9::LUC data N = 4; TOC1::LUC data N = 3; ELF4::LUC data N = 3. For all, n = 7–18. N represents the number of independent experiments and n the total number of organs tracked.
