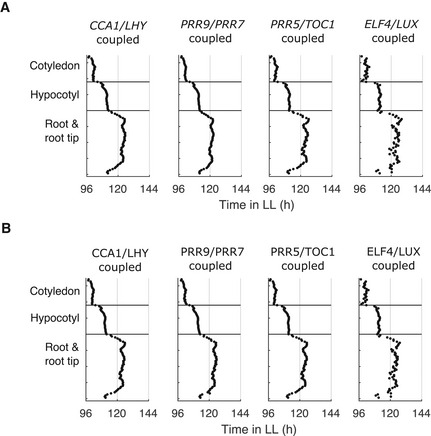
Figure EV2. Peaks of simulated expression with the local sharing of different clock molecules between cells.

-
A, BThe times of the final peaks of simulated PRR9/PRR7 intensity plots, simulated with the sharing of CCA1/LHY, PRR9/PRR7, PRR5/TOC1, or ELF4/LUX mRNA (A) or protein (B) locally between neighbor cells. Simulations were performed under LL with local cell‐to‐cell coupling (Jlocal = 2).
Data information: Data in (A) (“CCA1/LHY coupled”) is replotted from Fig 3D and data in (B) (“ELF4/LUX coupled”) is replotted from Fig 4B.
