
Figure 3. Local sharing of clock components can reproduce experimentally observed spatial waves of clock gene expression.
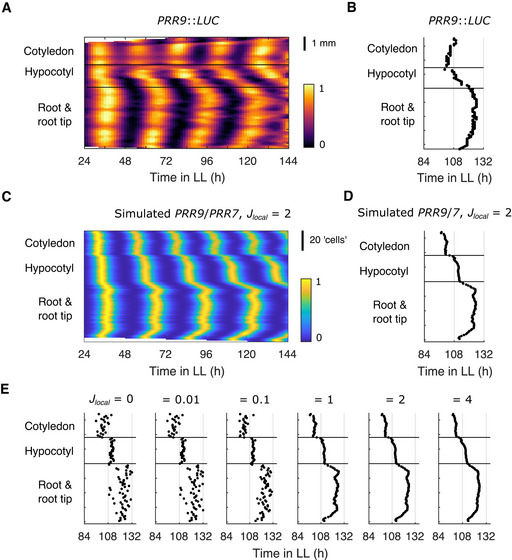
- Representative intensity plot of PRR9::LUC expression measured from longitudinal sections of a single seedling under LL.
- Times of the final peaks of the PRR9::LUC intensity plot.
- Representative intensity plot of simulated PRR9/PRR7 expression measured from longitudinal sections of a single seedling under LL. Simulations assumed varied light sensitivities and local cell‐to‐cell coupling (Jlocal = 2).
- Times of the final peaks of the simulated PRR9/PRR7 intensity plot.
- Times of the final peaks of simulated PRR9/PRR7 intensity plots, each simulated under LL with increasing strengths of local cell‐to‐cell coupling.
Data information: Experimental data is an analysis of Arabidopsis time‐lapse movies carried out previously (Greenwood et al, 2019). N = 4 and n = 7–14, where N represents the number of independent experiments and n the total number of organs tracked. Data in (D) is replotted within (E) as “Jlocal = 2” and Fig EV2A as “CCA1/LHY coupled”. (E) is replotted as Fig EV3A and Appendix Fig S8A.