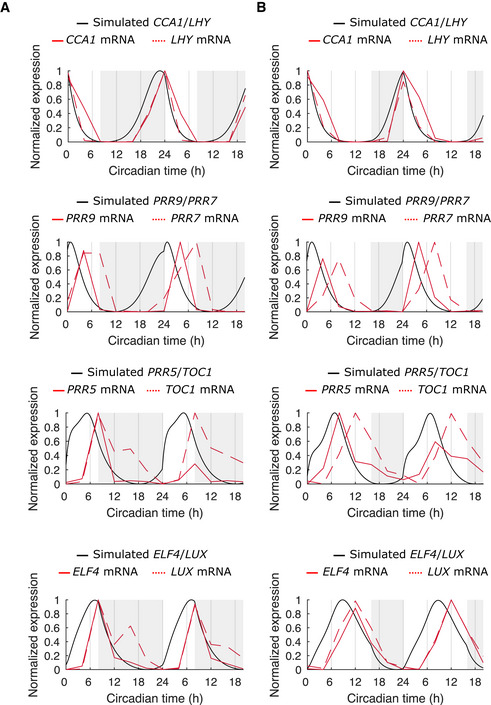
Figure EV4. Simulations under short‐ and long‐day lengths approximate experimental data.

-
A, BSimulated (black line) and experimental (red line) expression of clock genes under idealized LD cycles with 8 h (A) or 16 h (B) day lengths. Simulations were implemented as a single cell, without variation in gene expression, and with Lsens = 1.
Data information: Experimental data are Arabidopsis whole‐plant averages obtained from the DIURNAL database (Mockler et al, 2007).
