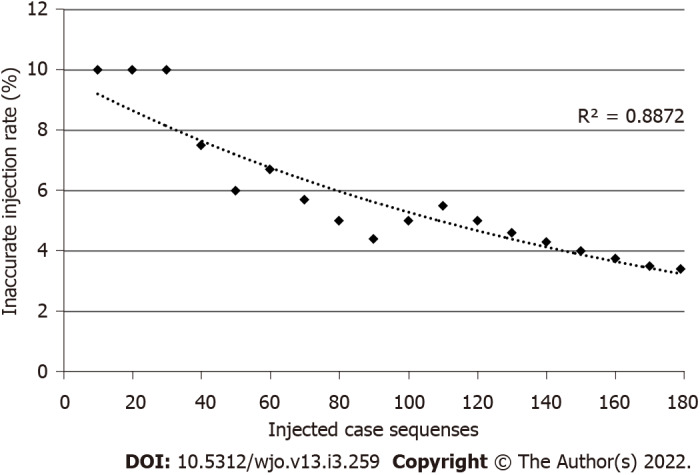
Figure 4.

Learning curve. The inaccurate injection rate is the total number of “major leakage” divided by the total number of injected cases that was recorded every 10 cases. The learning curve is represented by the dotted curve. Spearman’s rank correlation coefficient was analyzed (R2 = 0.887, P < 0.001).
