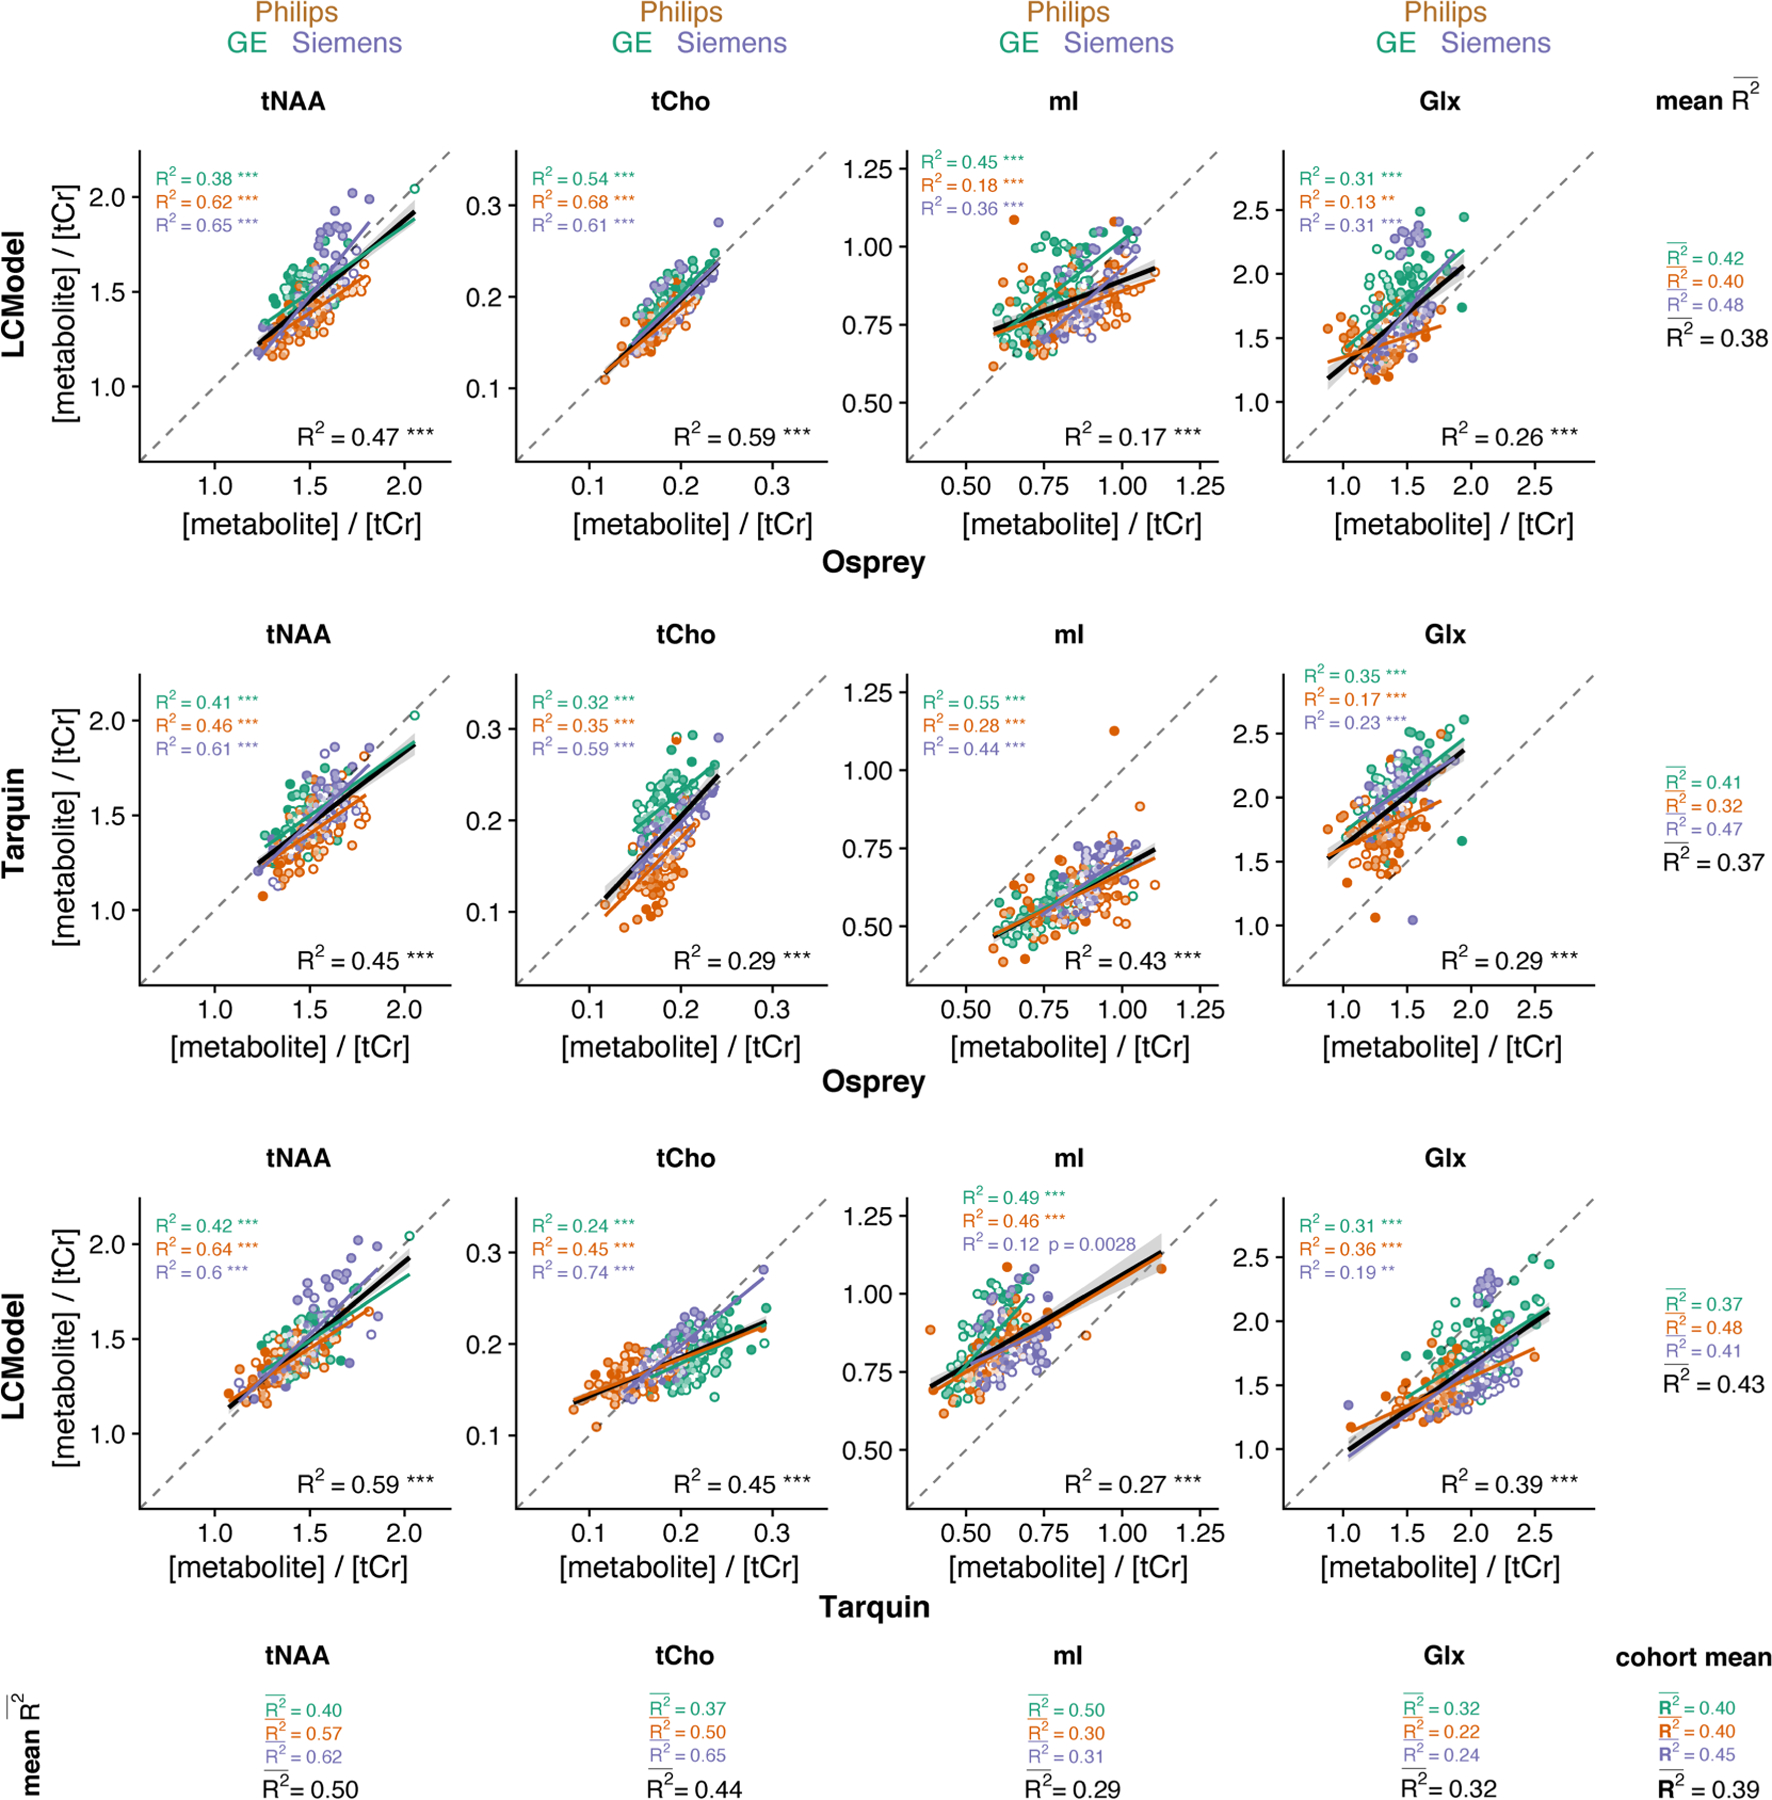
FIGURE 5.

Pair-wise correlational comparison of algorithms. LCModel and Osprey are compared in the first row, Tarquin and Osprey in the second row, and LCModel and Tarquin in the third row. Each column corresponds to a different metabolite. Within-vendor correlations are color-coded; global correlations are shown in black. The values are calculated along each dimension of the grid with mean R2 for each metabolite and each correlation. A cohort-mean value is also calculated across all 12 pair-wise correlations. Asterisks indicate significant correlations (adjusted p < 0.01 = ** and adjusted p < 0.001 = ***)
