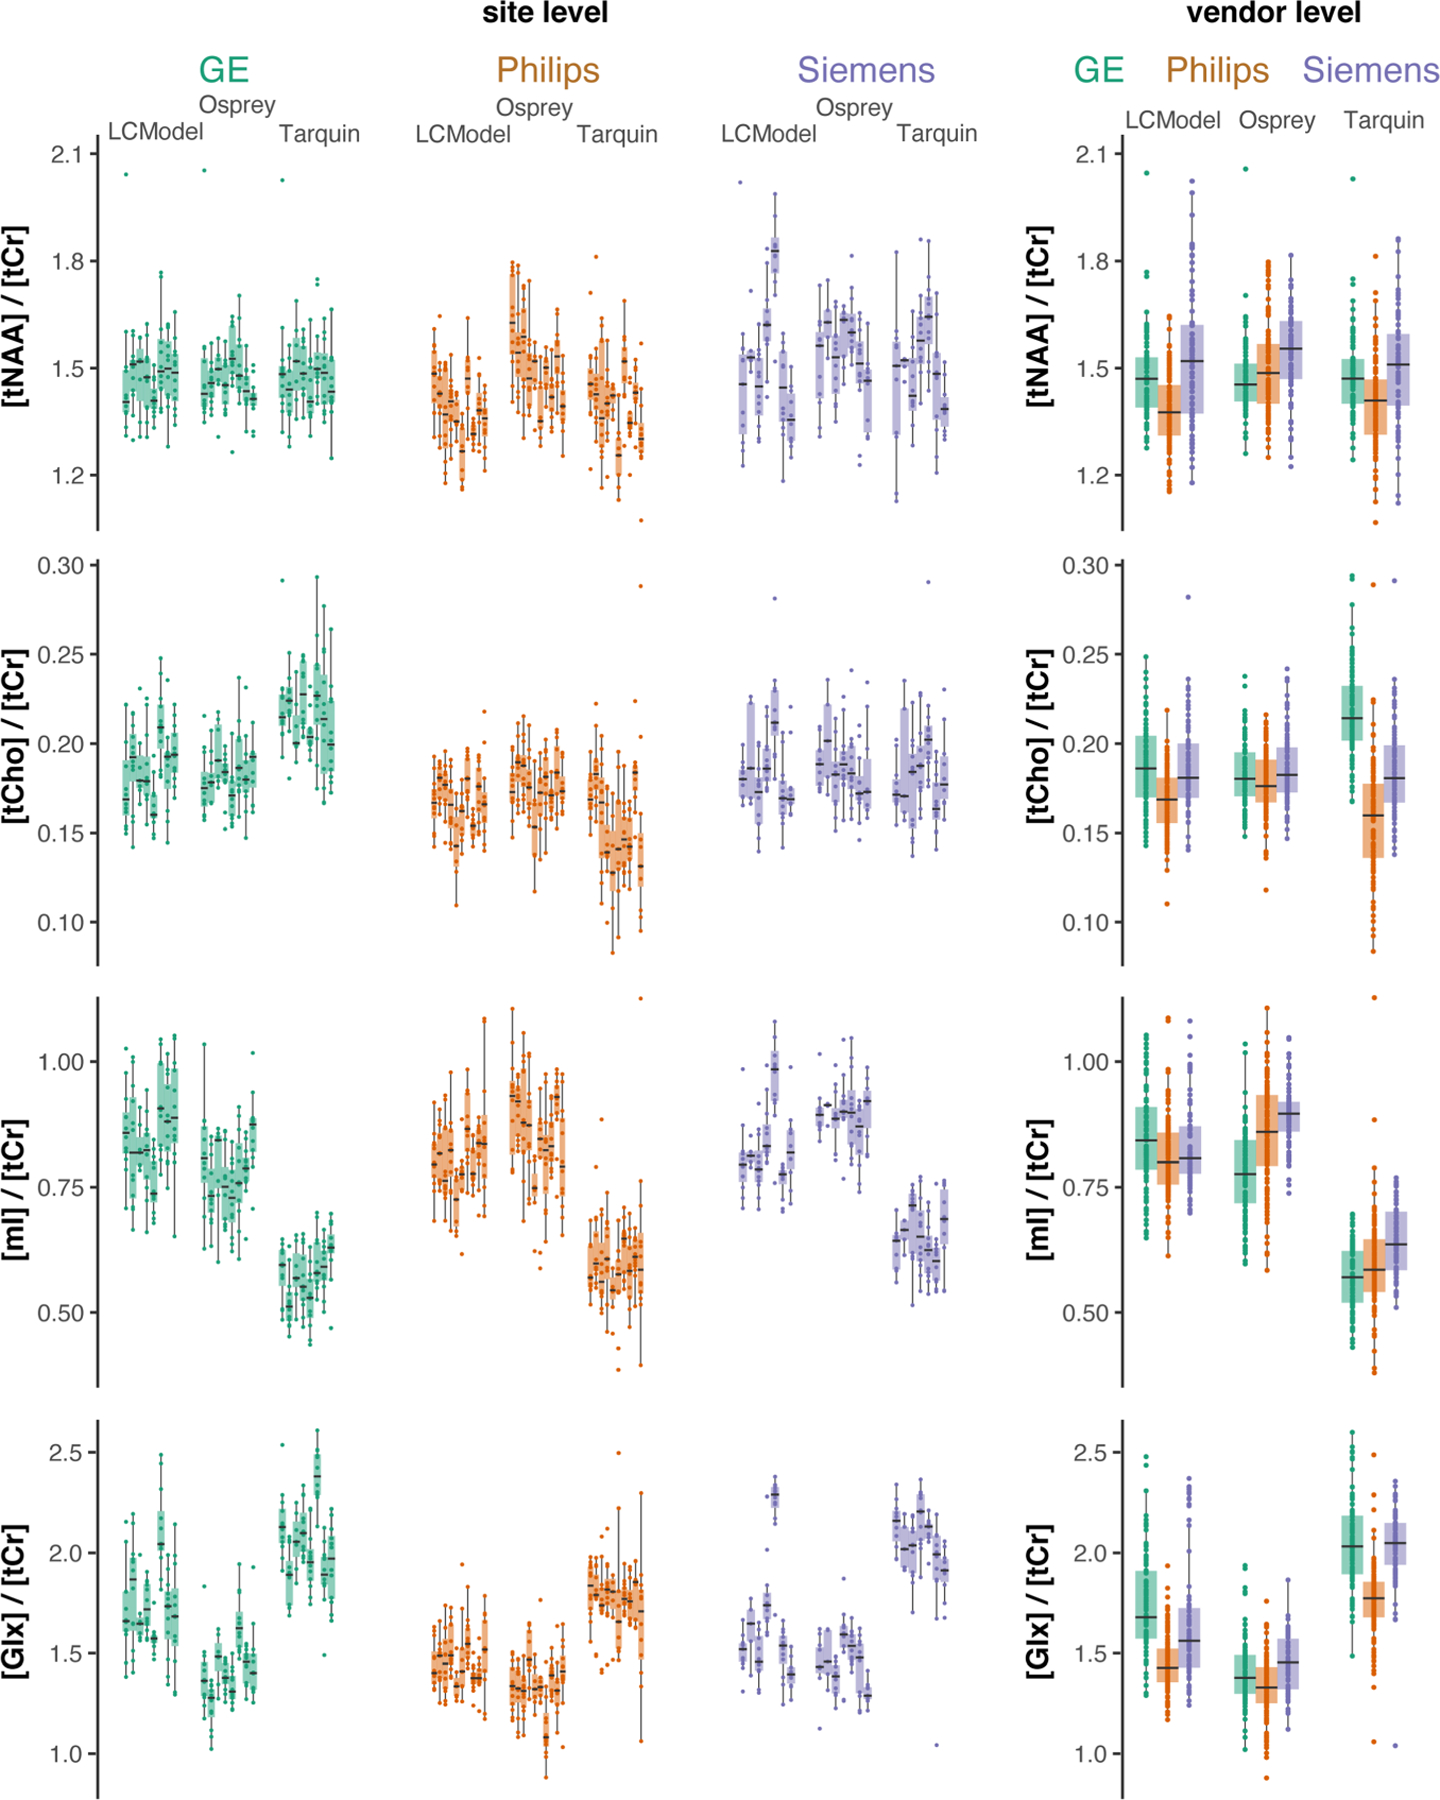
FIGURE 7.

Metabolite level distribution by site. Boxplots of the metabolite estimates of each LCM algorithm and vendor (color-coded). Each site is represented as a single box with individual data points. The four metabolites are reported in the rows and the three vendors are represented in the columns. The fourth column represents the vendor-collapsed distributions
