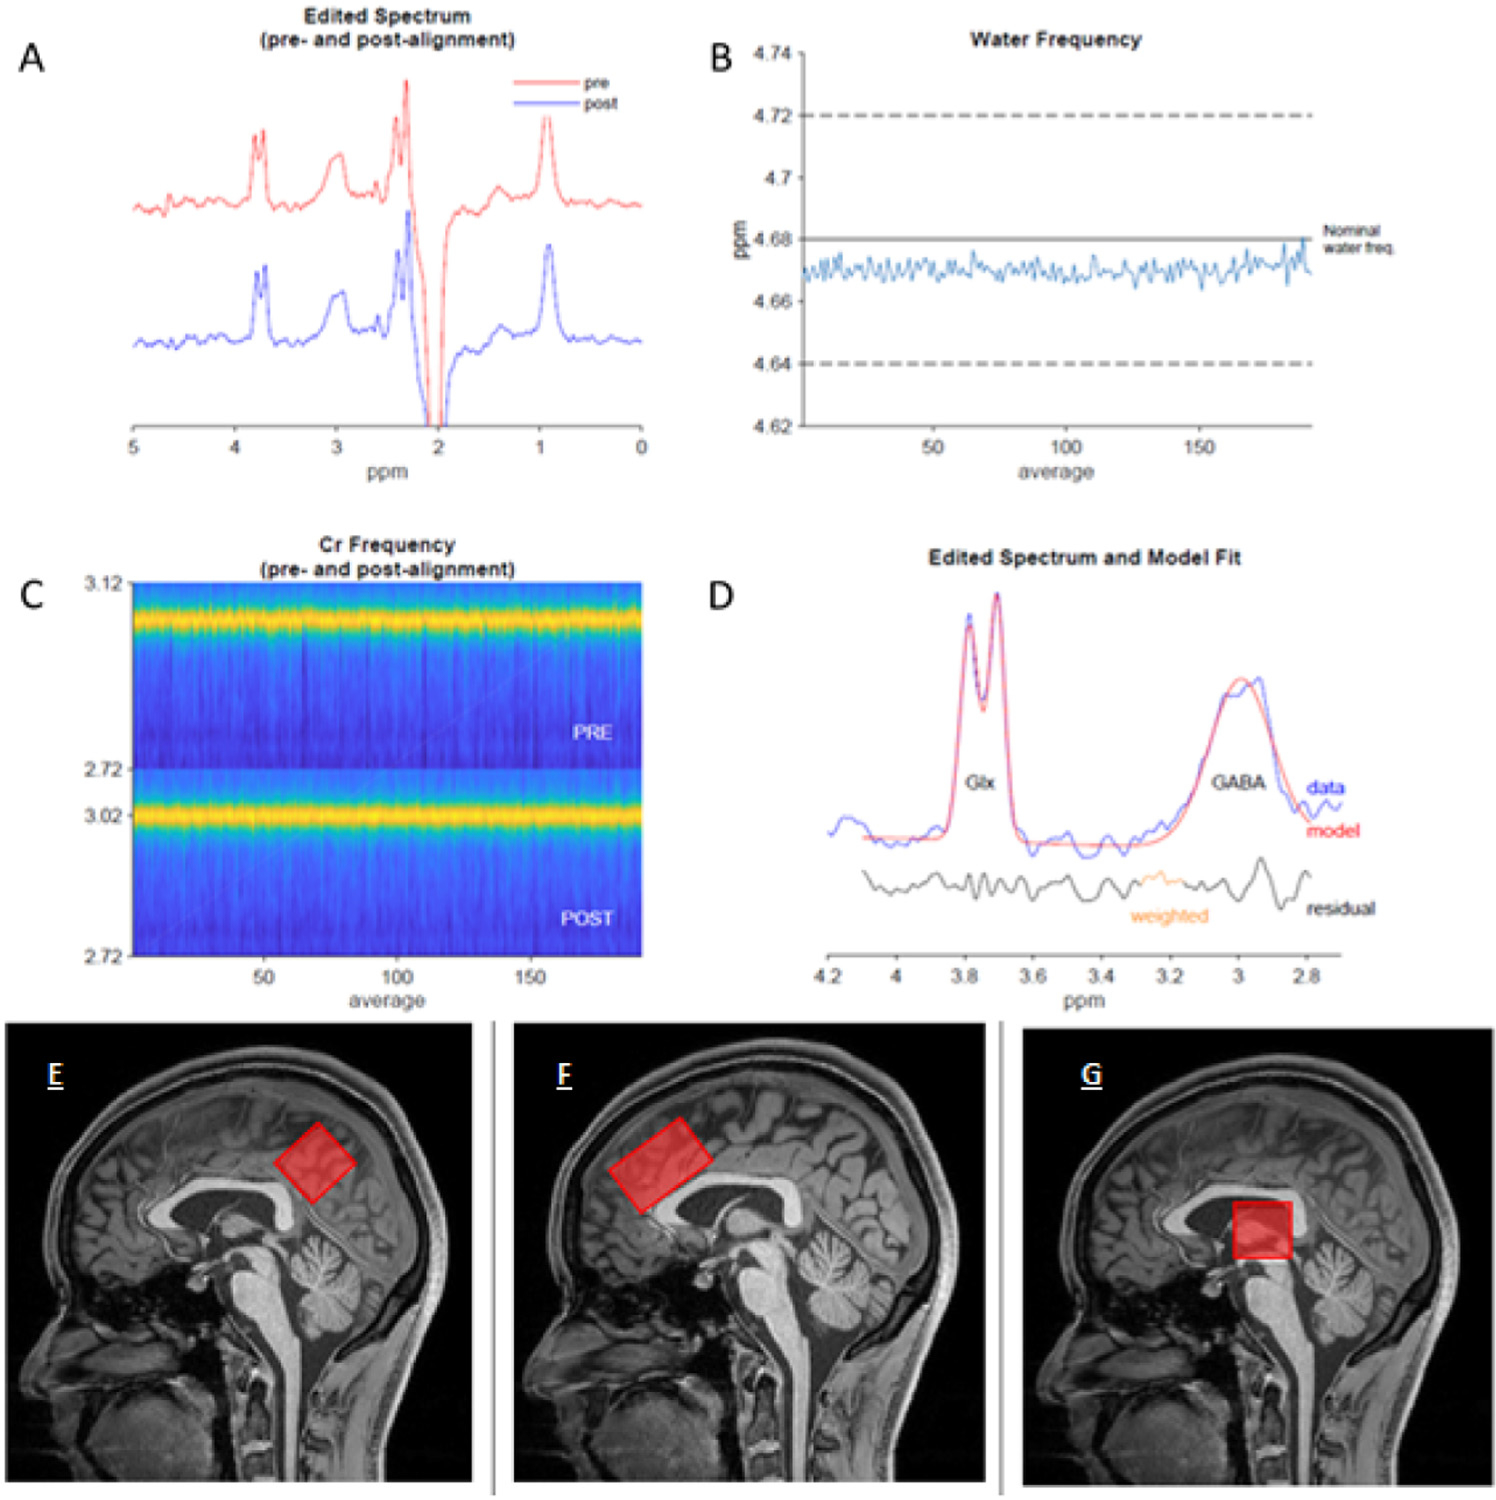
Figure 2.

Example spectra from the PCG of a participant following fitting, and visual representation of voxel positioning. Example Gannet output taken from a migraine participant. (A) Demonstrates the processed GABA-edited difference spectrum before frequency and phase correction (red) and after (blue) (B) Shows the residual water signal plotted against time, demonstrating the stability of the experiment with respect to eg, field drift, or motion, (C) Shows the creatine signal (yellow) over the duration of the experiment, pre- refers to before frequency-and-phase correction and post refers to after. (D) Shows the output from the GannetFit module. The GABA-edited spectrum is shown in blue, the model in red, and the fit residual in black below. Schematic diagram to demonstrate the voxel placement for (E) PCG, (F) ACC and (G) thalamus.
