Figure 3.

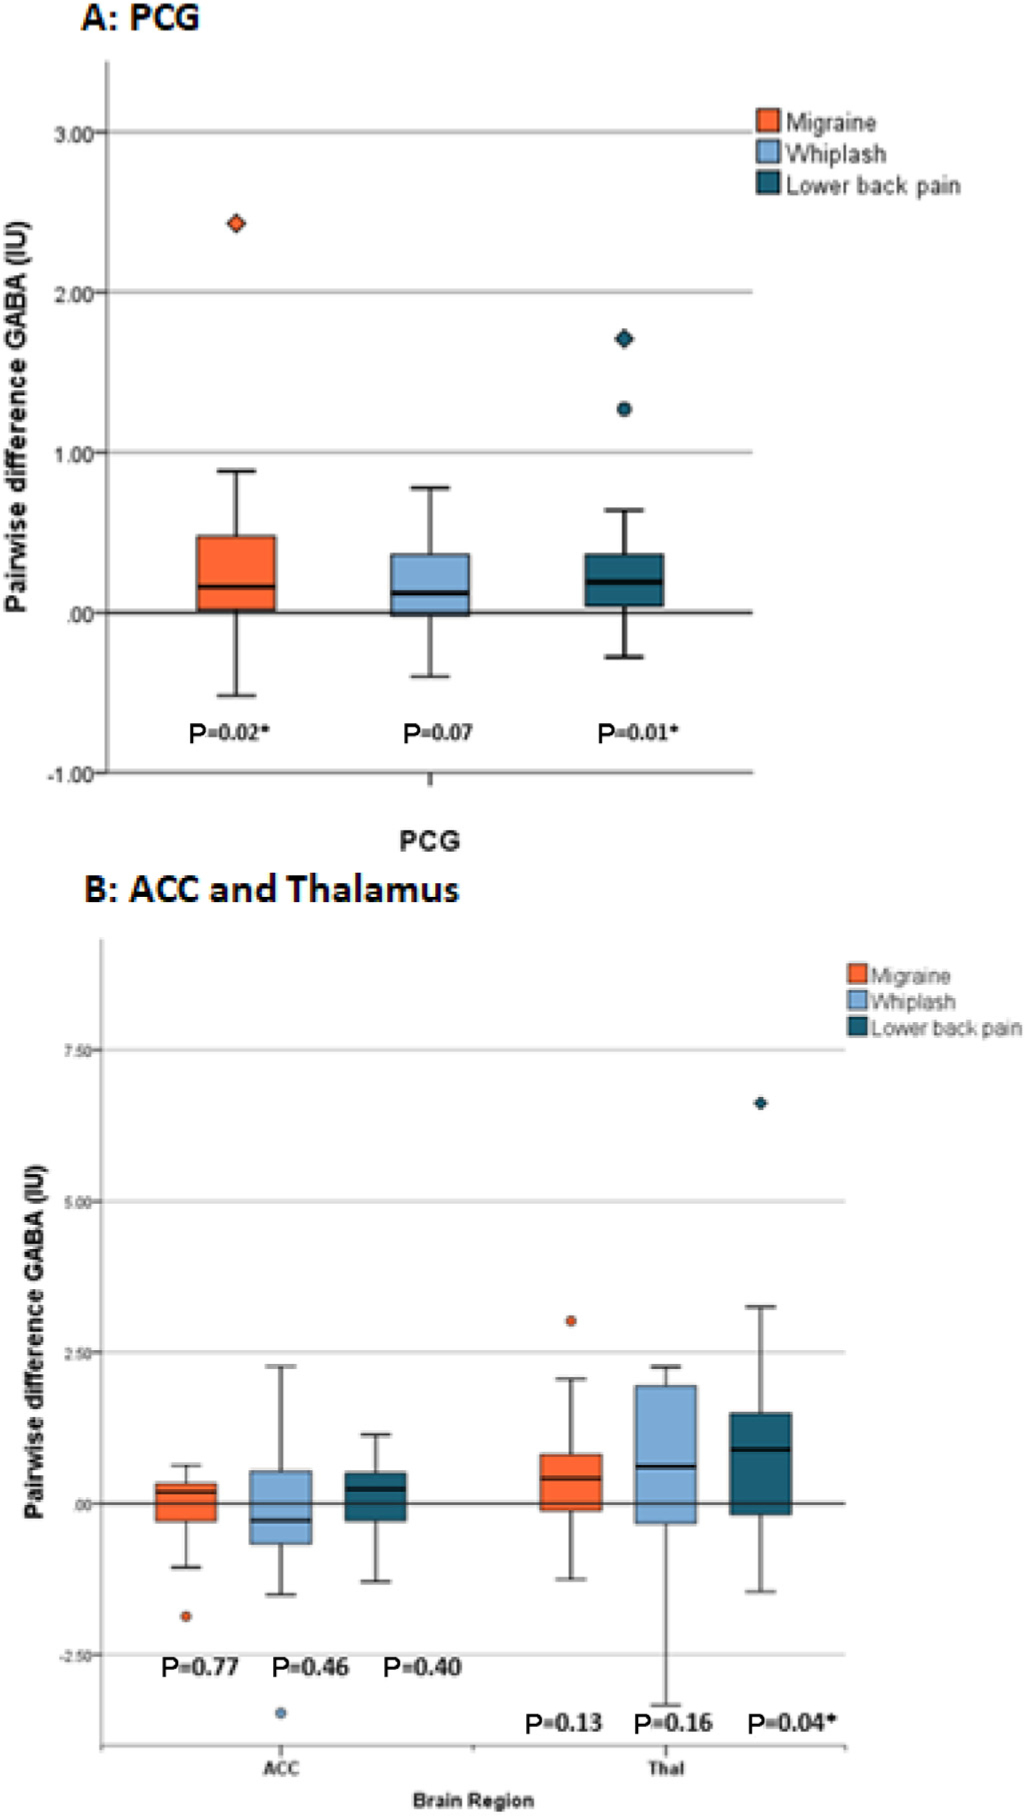
Pair-wise difference in GABA+ (IU) between pain groups and control. (A) Pairwise difference GABA+ (IU) in pain groups compared to control for the PCG. (B) Pairwise difference GABA+ (IU) in pain groups compared to control for the ACC and thalamus. Data are presented as box plots where the boxes represent the interquartile range (IQR), the line within the box demonstrate the median, and the outer whiskers represent the range of data. Outliers are plotted as circles where they reach >1.5 IQR below or above the 25th or 75th percentile and diamonds where they reach >3 IQR below or above the 25th and 75th percentile. P values with stars indicate the statistically significant difference in GABA+ levels between pain group and control.
