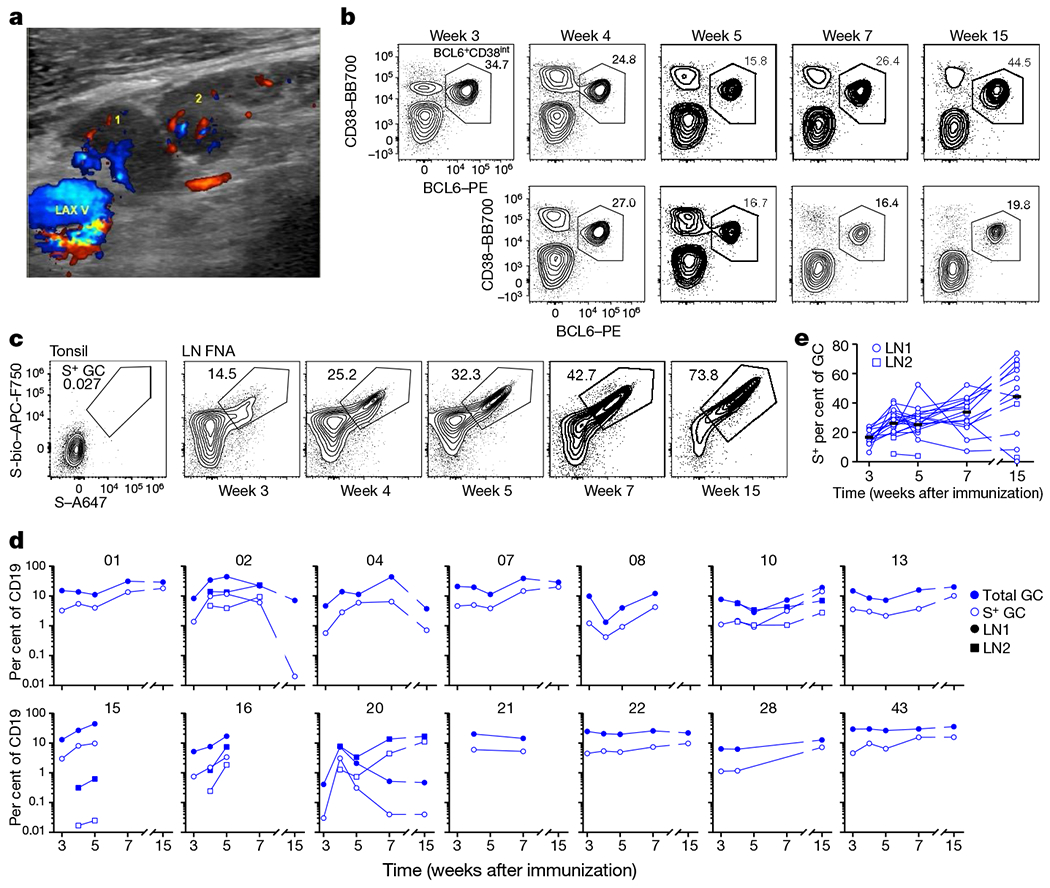
Fig. 2|. Germinal centre B cell response to SARS-CoV-2 immunization.

a, Representative colour Doppler ultrasound image of two draining lymph nodes (‘1’ and ‘2’) adjacent to the axillary vein ‘LAX V’ 5 weeks after immunization. b, c, Representative flow cytometry plots of BCL6 and CD38 staining on IgDlowCD19+CD3− live singlet lymphocytes in FNA samples (b; LN1, top row; LN2, bottom row) and S staining on BCL6+CD38int germinal centre B cells in tonsil and FNA samples (c) at the indicated times after immunization. d, e, Kinetics of total (blue) and S+ (white) germinal centre (GC) B cells as gated in b and c (d) and S-binding per cent of germinal centre B cells (e) from FNA of draining lymph nodes. Symbols at each time point represent one FNA sample; square symbols denote the second lymph node sampled (n = 14). Horizontal lines indicate the median.
